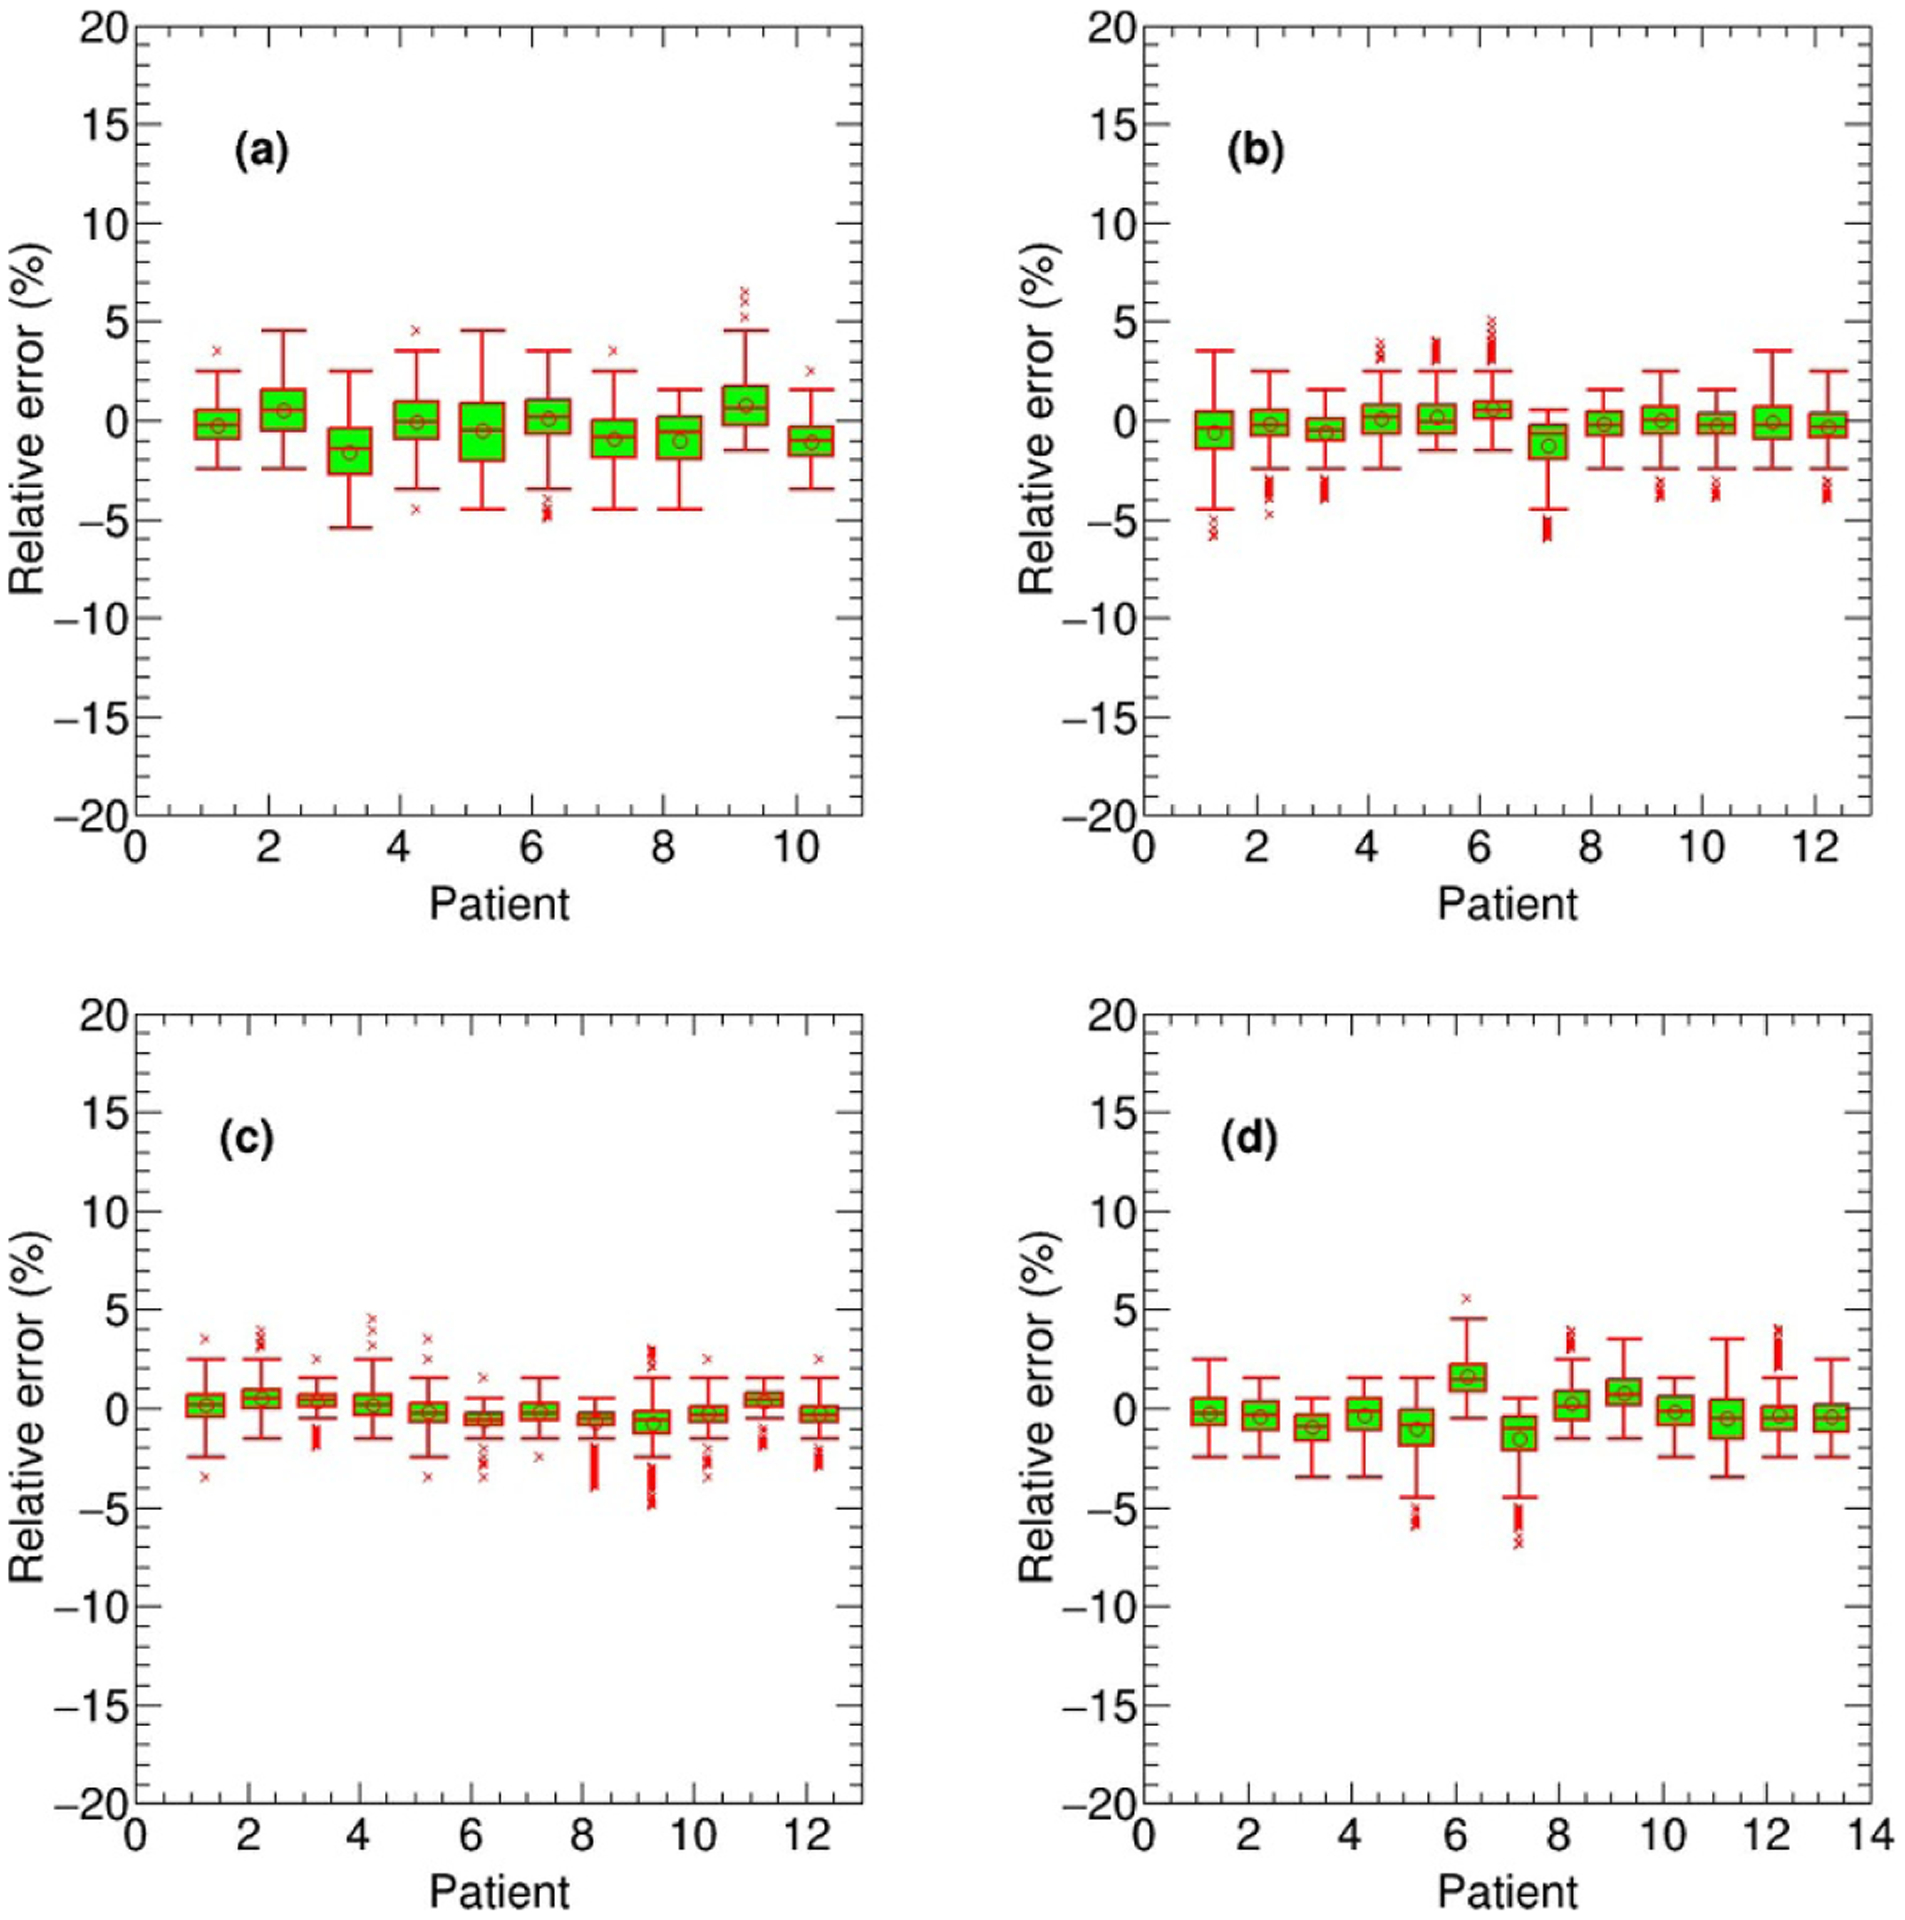
Figure 7.

The box-whisker plots of the OAR per-voxel bias of the DL calculated dose (normalized to the prescription) relative to the TPS calculated dose for all 47 test cases categorized by disease site: brainstem in nasopharyngeal cancer (a), spinal cord in lung cancer (b), heart in breast cancer (c) and right femoris in rectum cancer (d).
