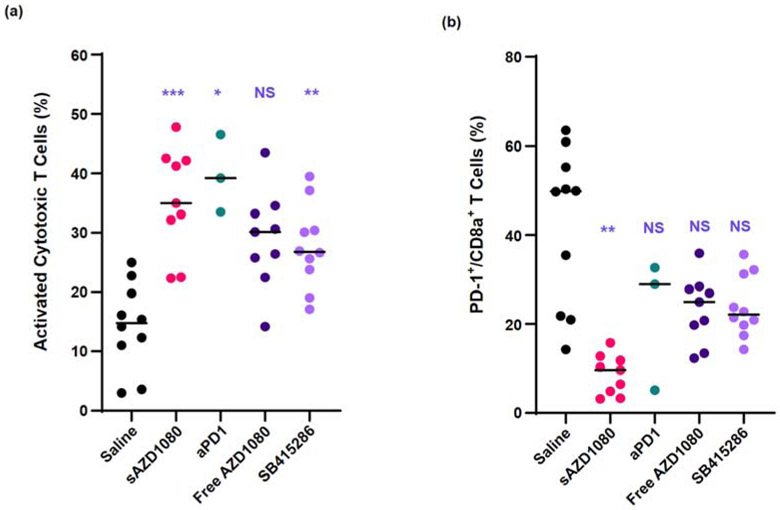
Figure 7.
Flow cytometry analysis of tumor-infiltrating CD8+ T-cells: (a) activated cytotoxic T-cells, i.e. CD107a+ Gzmb+ CD3+ CD8+ cells; (b) PD-1 staining intensity. Group sizes: n = 10 for saline and SB415286 treatments, n = 9 for free AZD1080 or sAZD1080 treatment, and n = 3 for anti-PD-1 (the reduced animal number for the latter group was due to disappearance or extremely reduced size of most of the tumors in this group). Statistical analysis was performed by Brown-Forsythe ANOVA and Dunnett’s T3 multiple comparisons test. * p < 0.05, ** p < 0.01, *** p < 0.001, **** p < 0.0001, NS = not significant.

