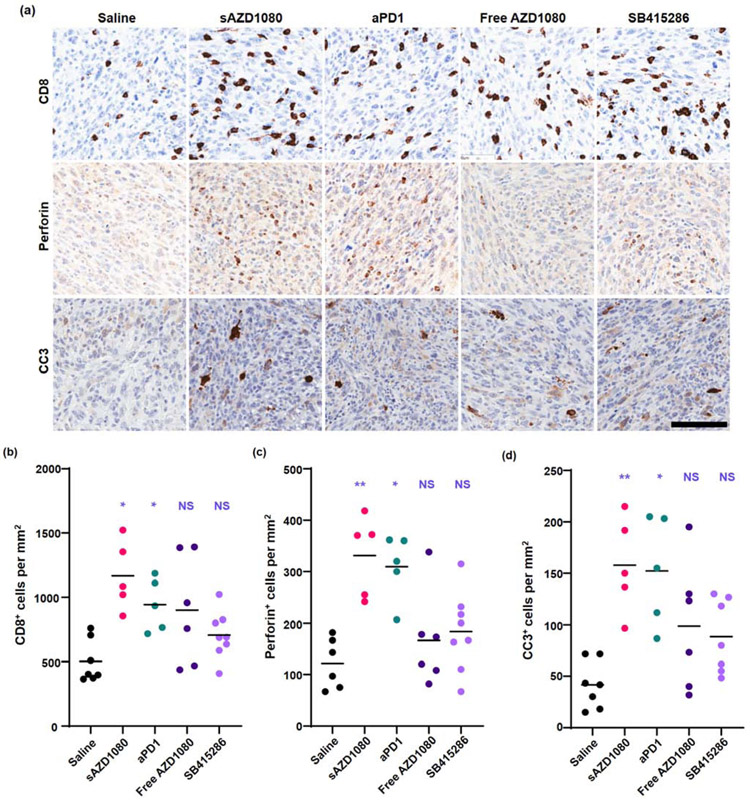
Figure 8.
Immunohistochemical analysis of MC38 subcutaneous tumors, obtained from the efficacy study in Fig. 6. (a) Representative images of tumor sections stained with anti-CD8, anti-perforin, or anti-cleaved-caspase 3 antibodies. Scale bar (lower right corner) = 100 μm; all images were reviewed under the same magnification. Quantitative image analysis showing: (b) CD8+ cells per mm2, (c) perforin -positive cells per mm2, and (d) cleaved caspase 3+ (CC3) cells per mm2. The bars represent the mean values for each group. Statistical analysis by 2-way Brown-Forsythe ANOVA and Dunnett’s T3 multiple comparisons test, n = 6 for saline and free AZD1080 treatments, 5 for silicasome AZD1080 and anti-PD-1 treatments, and 8 for SB415286 treatment. * p < 0.05, ** p < 0.01.

