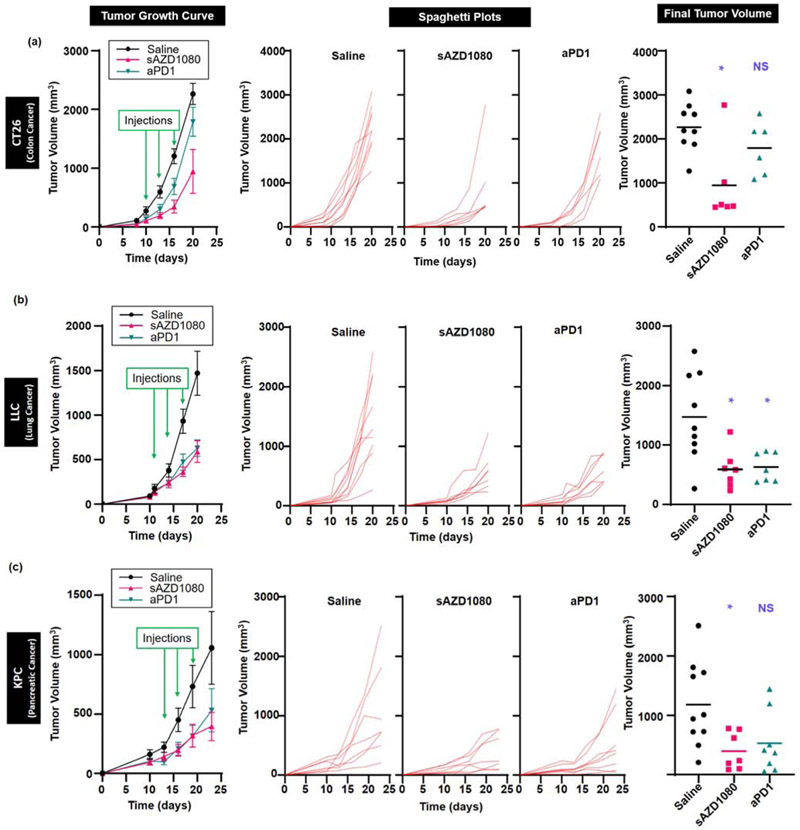
Figure 9.
Tumor growth inhibition by PD-1/PD-L1 axis inhibition in three additional syngeneic tumor models in mice. Tumor volume shrinkage in response to treatment with anti-PD-1 antibody or silicasome AZD1080 for: (a) CT colon cancer model, (LLC lung cancer model, and (c) KPC pancreatic cancer model. Animal treatment is discussed in the methods section. For each model, tumor volume growth curves are shown starting from time of inoculation to time of sacrifice. Green arrows represent days of treatment administration. Error bars = SEM. The spaghetti plots are used to show the growth curve for every animal, in addition to showing shrinkage of the final tumor volumes for each model. The error bars represent the mean values in each group. Statistical analysis by Brown-Forsythe ANOVA and Dunnett’s T3 multiple comparisons test. For CT26, n = 9 for saline treatment and n =6 for silicasome AZD1080 and anti-PD-1 treatments. For LLC, n = 9 for saline and 7 for silicasome AZD1080 and anti-PD-1 treatments. For KPC, n = 10 for saline, 7 for silicasome AZD1080, and 8 for anti-PD-1 treatments. * p < 0.05.

