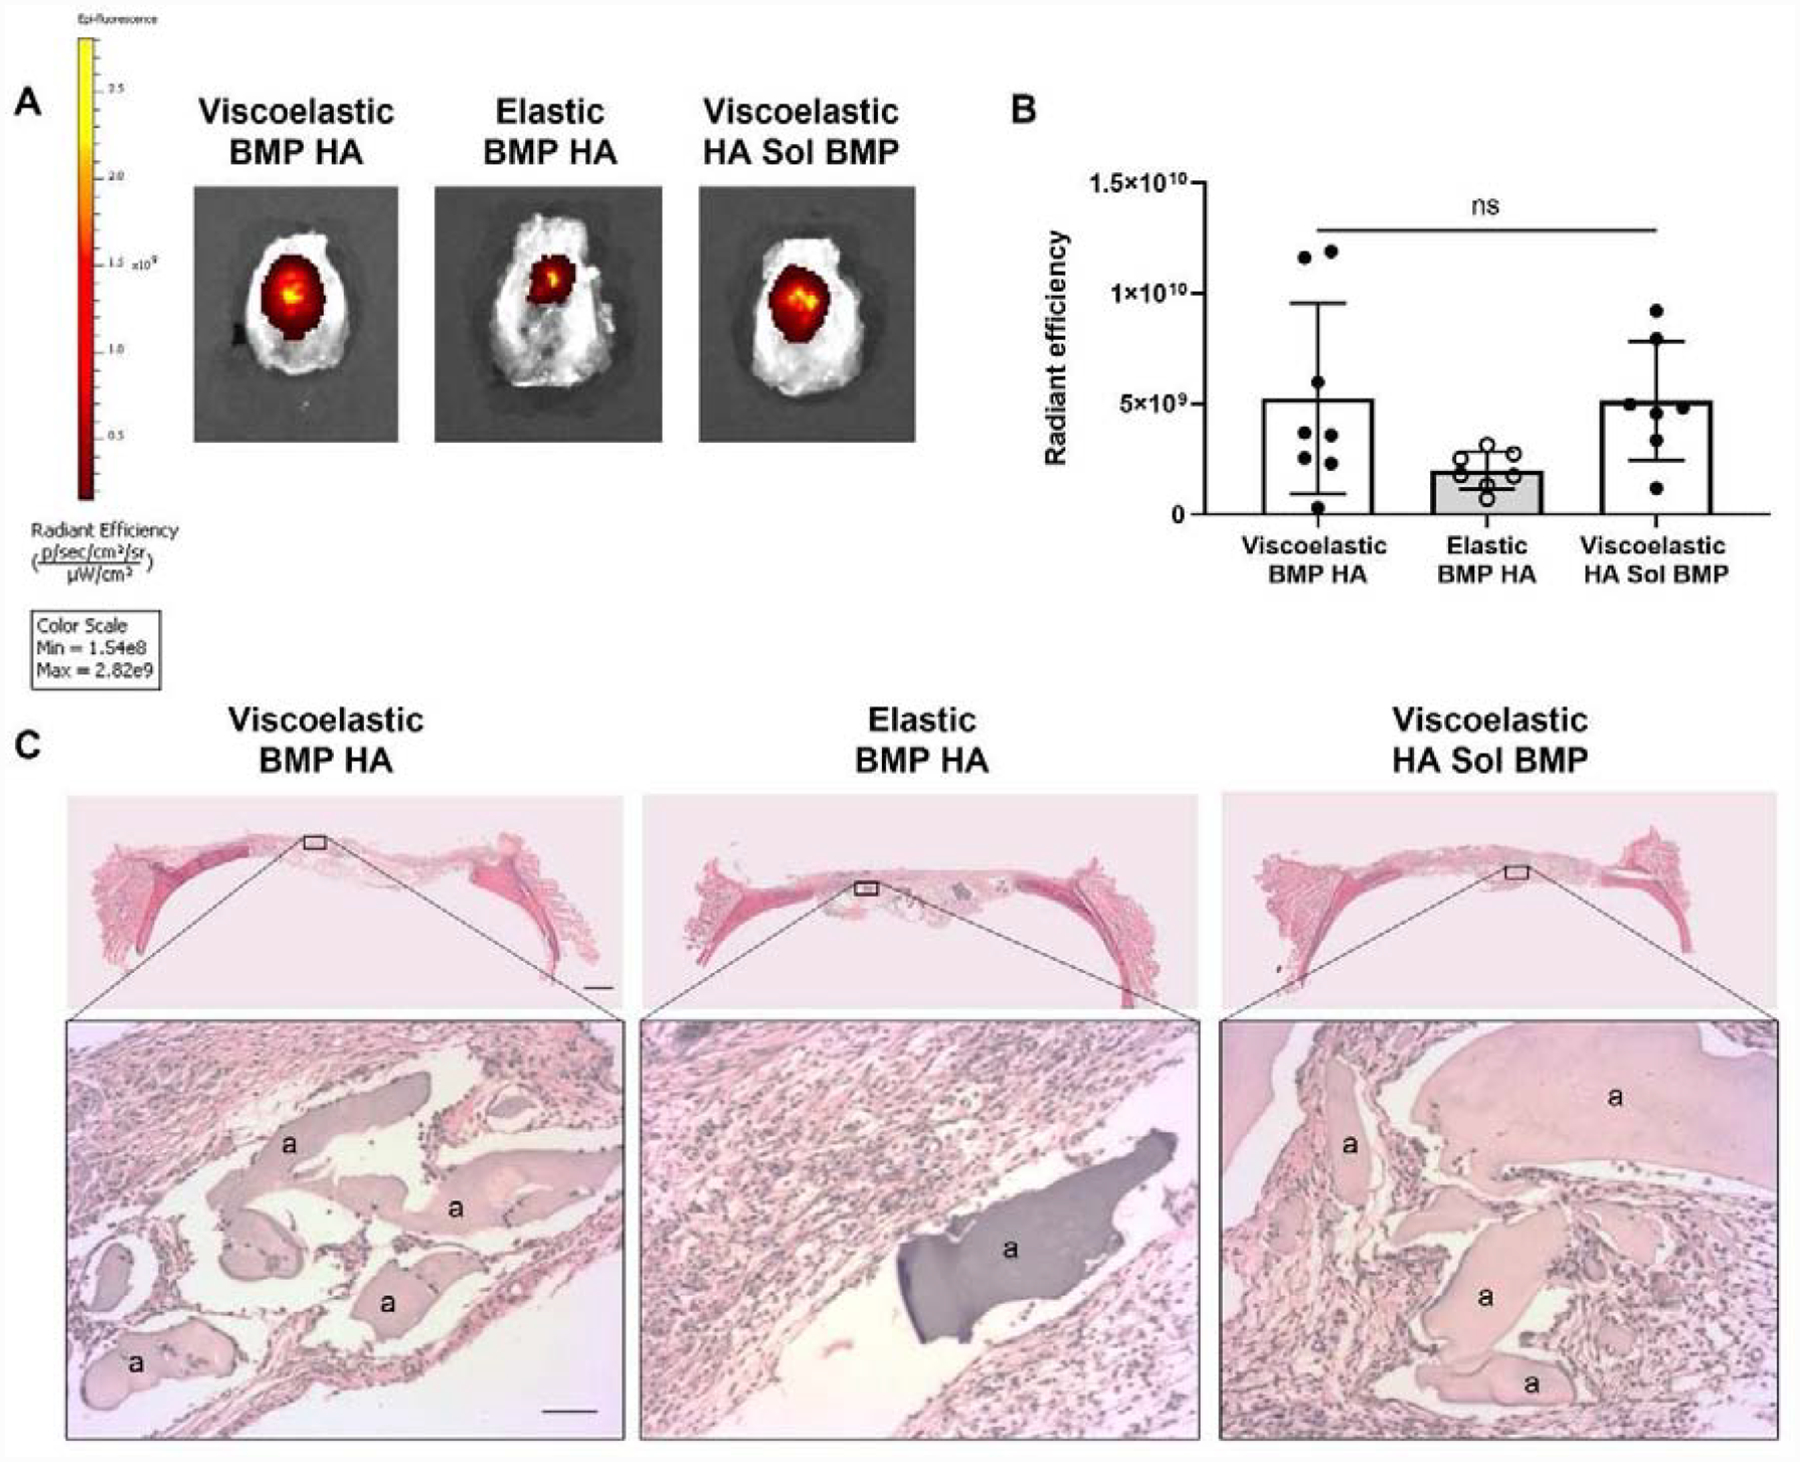
Figure 5. MSC spheroids persist in vivo.

(A) Representative images of explanted rat calvariae 2 weeks post-implantation exhibit NIR signal localized to the defect site. (B) Quantification of the NIR signal in each experimental group. Significance is denoted by alphabetical letterings; ns denotes no significance among all groups (n=7–8). (C) Representative images of H&E staining of calvarial defects from each group. Top images are large scans of an entire cross-section of the defect. Scale bar is 1 mm. The bottom insert images are 10X magnified regions of interest. The “a” denotes alginate. Bottom scale bar is 200 μm.
