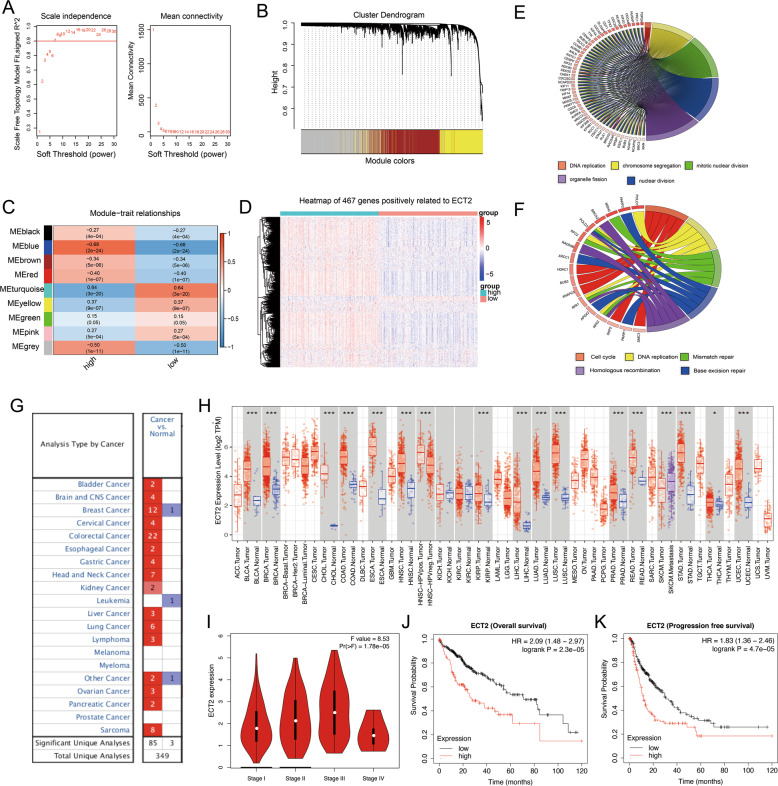
Fig. 2. Construction of ECT2-based WGCNA network and gene expression and prognosis analysis.
A Optimal threshold in the WGCNA. B Heatmap of module clustering. C Diagram of the module-trait relationships of ECT2. D Heatmap of the genes co-expressed with ECT2 in the TCGA-LIHC cohort. E GO enrichment analysis of the genes co-expressed with ECT2. F KEGG enrichment analysis of the genes co-expressed with ECT2. G Expression of ECT2 in multiple tumors in the Oncomine database. Blue indicates low expression in tumor tissue relative to normal tissue, and red indicates high expression in tumor tissue relative to normal tissue. The number represents the number of corresponding studies. H Expression of ECT2 in the pan-cancer and control groups. I Correlation analysis of ECT2 and clinical stage in the GEPIA database. J OS curve of the effect of ECT2 expression in the TCGA-LIHC cohort. K PFS curve of the effect of ECT2 expression in the TCGA-LIHC cohort.

