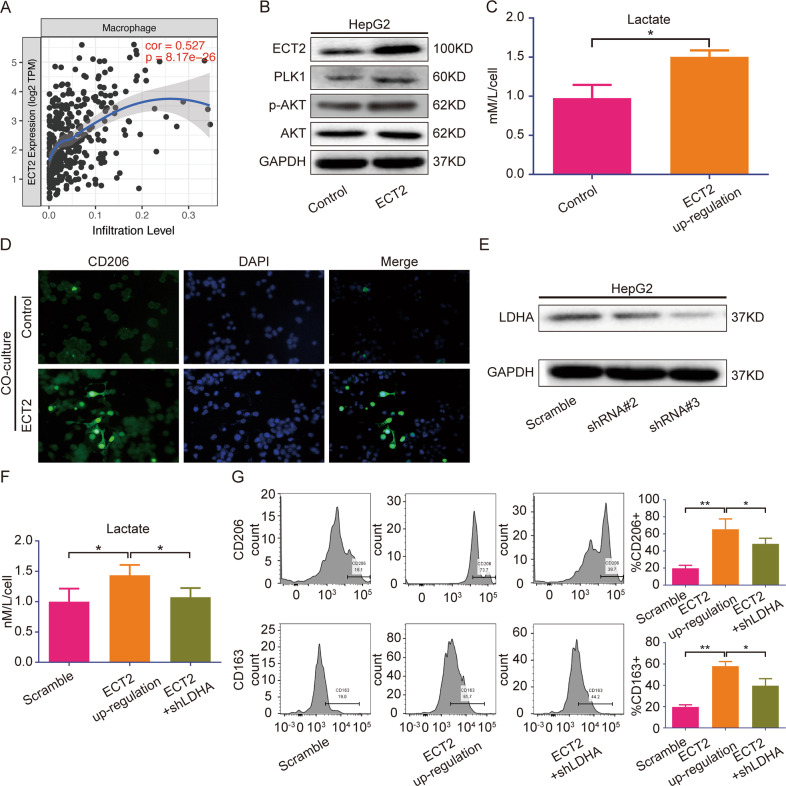
Fig. 6. ECT2 overexpression increases the production of lactic acid and subsequently promotes M2 macrophage polarization.
A Correlation analysis between ECT2 and macrophages. B Western blot analysis of p-AKT, PLK1, and AKT expression levels after ECT2 was overexpressed in the HepG2 cell line. C Lactate acid production by cancer cells was evaluated after ECT2 was overexpressed. D Immunofluorescence analysis of macrophage polarization markers. E Western blot analysis was used to evaluate the effect of LDHA knockdown. F Lactate acid production by cancer cells was evaluated after ECT2 was overexpressed and/or LDHA was knocked down. G CD206 and CD163, which are polarization markers, were evaluated by flow cytometry after macrophages were co-cultured with cancer cells whose LDHA and/or ECT2 expression was influenced. Error bars represent means ± SD. *p < 0.05, **p < 0.01. NS means “not significant” by paired two-sided Student’s t-test.

