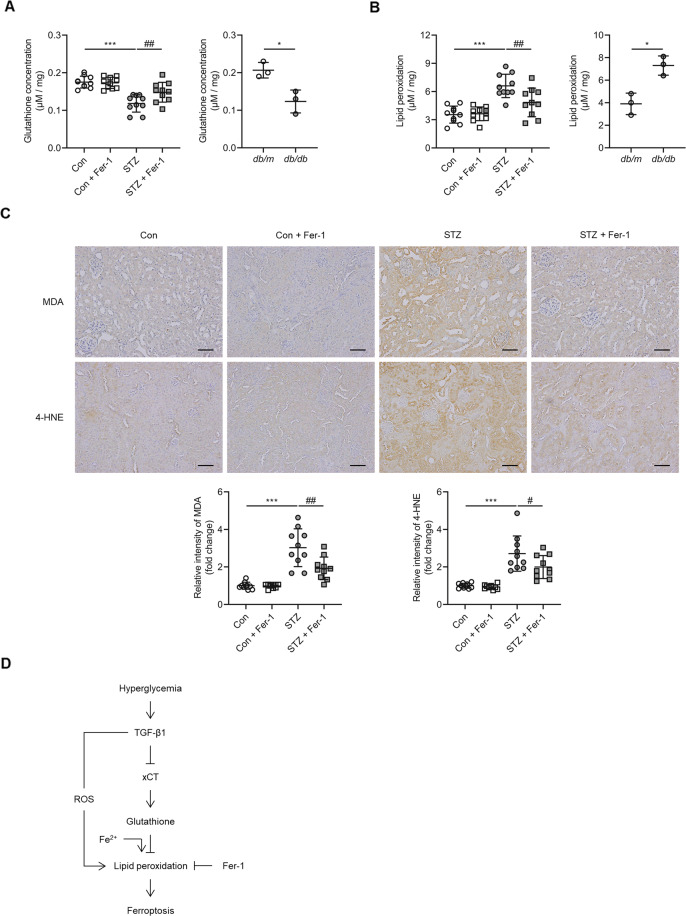
Fig. 6. Effect of Fer-1 on glutathione concentration and lipid peroxidation in the kidney of diabetic mice.
A Glutathione concentration in the kidneys of STZ and db/db mice. B Lipid peroxidation assessed by MDA levels in the kidneys of STZ and db/db mice. C Immunohistochemistry for MDA and 4-HNE was significantly increased in the STZ group, and this was abrogated by administration of Fer-1. D Schematic diagram of TGF-β1-induced ferroptosis in diabetic nephropathy. One-way ANOVA and Bonferroni post hoc tests were used for statistical analysis. Error bars represent SD. Original magnification, ×20 for all. Scale bar = 100 µm. *P < 0.05; ***P < 0.001 versus Con group. #P < 0.05; ##P < 0.01 versus STZ group; ROS reactive oxygen species. n = 10 for each group of STZ. n = 3 for each group of db/db.

