Figure 1.

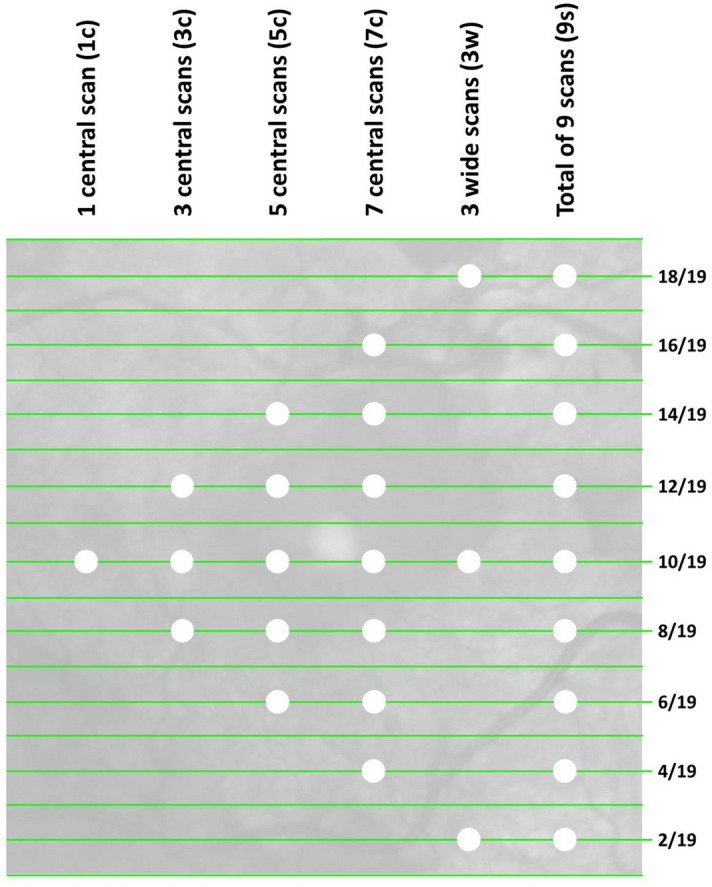
Illustration of an infrared image linked to an OCT volume scan that consists of 19 B-scans. The white dots indicate which scans (green lines) have been included in the different sub selections of B-scans (columns).

Illustration of an infrared image linked to an OCT volume scan that consists of 19 B-scans. The white dots indicate which scans (green lines) have been included in the different sub selections of B-scans (columns).