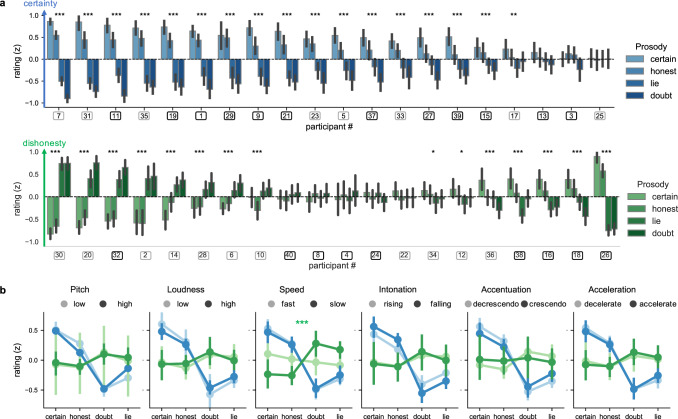
Fig. 3. Relationship between perceptual and conceptual knowledge (study 2B).
a Normalized (z-scored) ratings in the certainty (top, blue; N = 20) and honesty (bottom, green; N = 20) tasks for each participant and prosody type (shown by different hues). Bar plots represent individual participants’ mean normalized ratings for each prosodic archetype, with error bars showing the 95% confidence interval. Data were sorted by effect magnitude. Squared markers below the plot show the listener’s gender (black: female; gray: male). Asterisks show the results of paired two-sided sample t tests comparing reliable versus unreliable prosodies for each individual listener, with *p < 0.05; **p < 0.01; ***p < 0.001 (individual p values are reported in the Source data file). At the level of the group, in the certainty task, both honest and certain prosodies were judged as more certain than doubtful (honest: p < 0.001 Bonferroni corrected post hoc Tukey HSD, d = 3.72; certain: p < 0.001, d = 4.14) and lying (honest: p < 0.001, d = 3.23; certain: p < 0.001, d = 3.72) prosodies. In the honesty task, greater inter-individual differences were observed (see detailed report in the main text). b Normalized ratings were split depending on participants’ responses at the explicit questions assessing their conceptual knowledge about epistemic prosody, which revealed that the relationship between prosody type and ratings did not vary with participants’ conceptual knowledge about certainty and honesty in general, with the exception of concepts about speed in the honesty task (shown by the green asterisk that represent the significant interaction between concepts about speed and prosody type on ratings of honesty). Data are presented as mean values with error bars showing the 95% confidence interval. Triple asterisks (***) show the significant results of the rmANOVA testing the interaction between concepts about speed and prosody in the honesty task, with normalized ratings as a dependent variable, p = 0.0007 (all other interactions were not significant). Source data and exact individual p values for a are provided as a Source data file.

