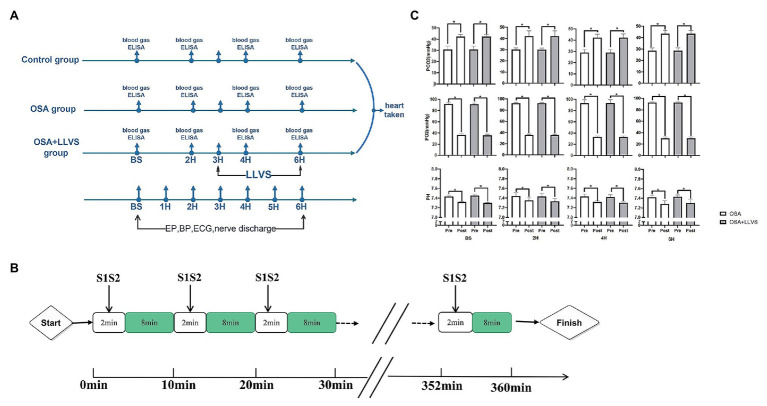
Figure 1.
Flow chart of the study protocol. (A). Acute OSA protocol. (B). Changes in blood gases pre- and post-apnea between the OSA and OSA+LLVS groups. (C). *p<0.05 vs. the pre-apnea; OSA, obstructive sleep apnea; LLVS, low-level vago-sympathetic trunk stimulation; EP, electrophysiology; BP, blood pressure; ECG, electrocardiography; PaO2, partial pressures of oxygen; PaCO2, partial carbon dioxide tension; ELISA, enzyme-linked immunosorbent assay; H, hours; min, minute.

