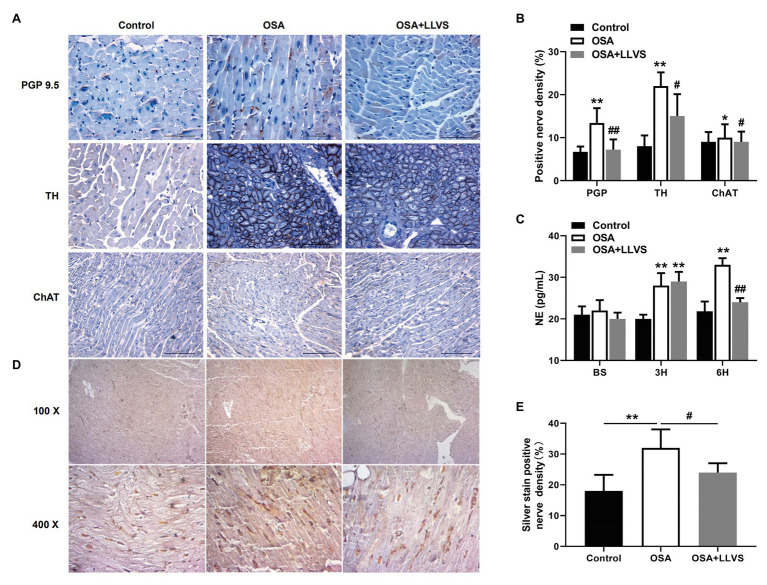
Figure 2.
(A) Representative immunohistochemical staining of PGP 9.5, TH, and ChAT on the LA among the three groups. (B) Quantitative analysis of PGP 9.5, TH, and ChAT-positive nerve density in the LA of each group. (C) The concentration of NE among the three groups at baseline, the 3rd hour, and the 6th hour. (D) Representative silver staining in the LA among the three groups. (E) Quantitative analysis of silver staining-positive nerve density in the LA of each group. *p<0.05, **p<0.01 vs. the control group; #p<0.05, ##p<0.01 vs. the OSA+LLVS group; PGP 9.5, protein gene product; TH, tyrosine hydroxylase; ChAT, choline acetyltransferase; NE, norepinephrine; H, hours.

