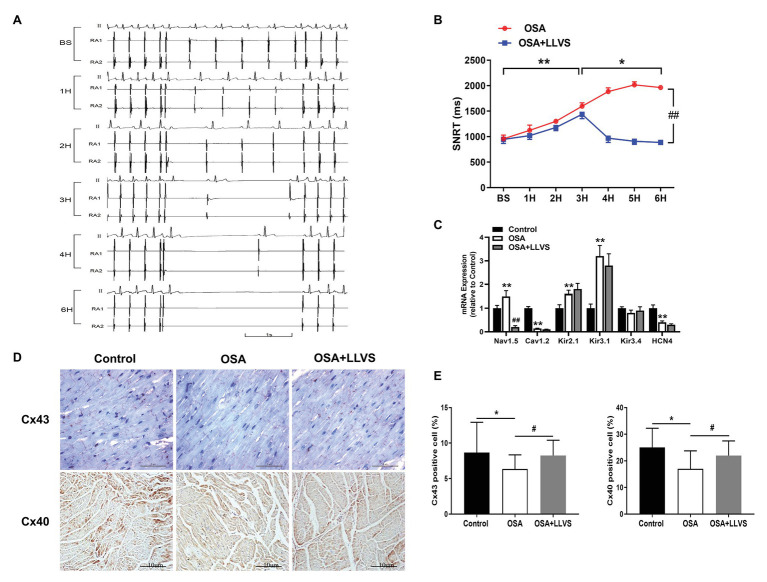
Figure 3.
(A) Representative examples of SNRT in the OSA group at baseline, the 1st hour, the 2nd hour, the 3rd hour, the 4th hour, and the 6th hour. (B) Changes in SNRT between the OSA and OSA+LLVS groups at each hour. (C) Changes in ion channels via gene expression level among the three groups. (D) Representative immunohistochemical staining of Cx 40 and Cx 43 on the LA among the three groups. (E) Quantitative analysis of Cx 43 and Cx 40-positive cells in the LA of each group. *p<0.05, **p<0.01 vs. the control group; #p<0.05, ##p<0.01 vs. the OSA+LLVS group; SNRT, sinoatrial node recovery time; Cx 43, connexin 43; Cx40, connexin 40; H, hours.

