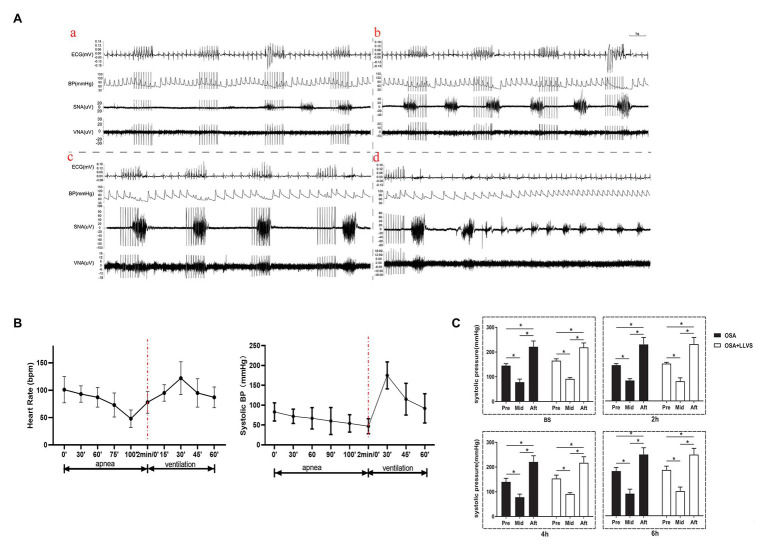
Figure 4.
(A) Neural activity recording during the process of apnea and re-ventilation, (a) representative examples of the neural recording at the first 40s of apnea, (b) representative examples of the neural recording at the second 40s of apnea, (c) representative examples of the neural recording at the third 40s of apnea, (d) representative examples of the neural recording at the first 40s of re-ventilation; (B) The dynamic changes in HR and BP before and after apnea in OSA; (C) Changes in BP pre and after apnea between the OSA and OSA+LLVS groups at baseline, the 2nd hour, the 4th hour, and the 6th hour. *p<0.05. BS, baseline; H, hours. HR, heart rate; BP, blood pressure.

