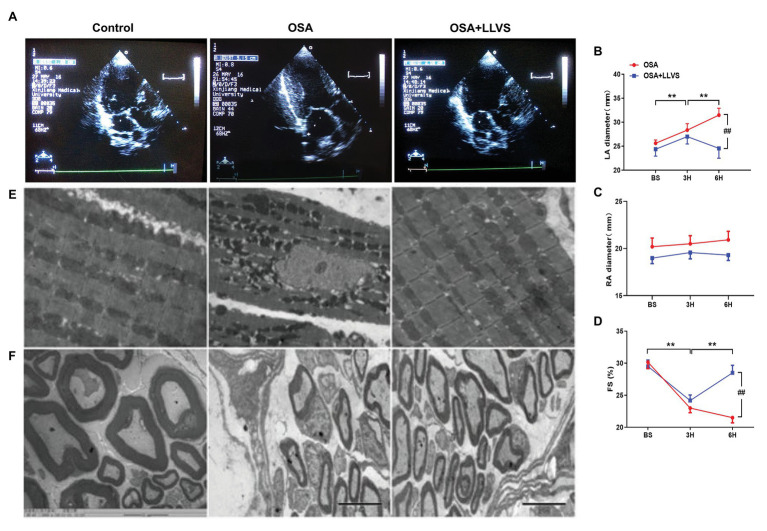
Figure 6.
(A) Echocardiography shows images of the LA among the three groups. (B) The LA gradually and significantly increased after OSA, and the LA decreased through LLVS treatment. (C) There was no statistically significant difference in RA among the three groups. (D) OSA-induced FS gradually shorten in the OSA group, and LLVS treatment significantly increased FS. (E) Changes in the mitochondrial and stellate ganglion (F) by transmission electron microscopy among the three groups. **p<0.05 vs. the control group; #p<0.05 vs. the OSA+LLVS group; LA, left atrium; RA, right atrium; FS, fractional shortening; BS, baseline; H, hours.

