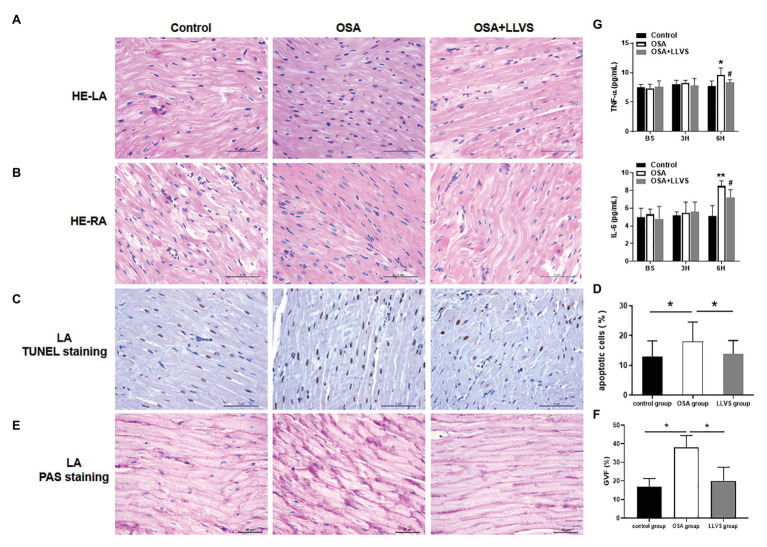
Figure 7.
Changes in cardiomyocytes among the three groups. HE staining showed that cardiomyocytes in the LA (A) and RA (B) were arranged tightly and orderly across the three groups. (C) Representative TUNEL staining on the LA across the three groups. (D) Quantitative analysis of TUNEL-positive cells in the LA of each group. (E) Representative PAS staining in the LA among the three groups. (F) Quantitative analysis of the glycogen volume fraction in the LA of each group. (G) The concentrations of TNF-α and IL-6 among the three groups at baseline, the 3rd hour, and the 6th hour. *p<0.05, **p<0.01 vs. the control group; #p<0.05 vs. the OSA+LLVS group; HE, hematoxylin and eosin; TUNEL, terminal deoxynucleotidyl transferase dUTP nick end labeling; PAS, periodic acid-Schiff; TNF-α, tumor necrosis factor alpha; IL-6, interleukin 6; H, hour.

