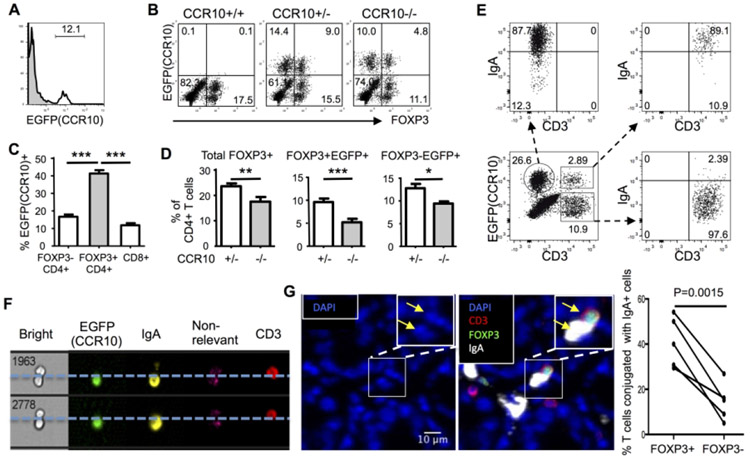
Figure 2.
CCR10+IgA+ cells preferentially conjugate with Treg cells in the colon. (A) Flow cytometric detection of EGFP(CCR10) on gated colonic LP CD45+CD3+CD4+ T cells in CCR10+/− mice. Gray areas are the staining of wild-type colonic T cells as negative controls for EGFP. Representative of more than 30 mice. (B) Representative flow cytometric analysis of gated colonic LP CD45+CD3+CD4+ T cells of CCR10+/− and CCR10−/− mice for EGFP(CCR10) and FOXP3. The CCR10+/+ sample is used as a negative control for EGFP. (C) Comparison of percentages of different subsets of colonic LP T cells in CCR10+/− mice that were positive for EGFP(CCR10). N≥7 mice of each genotype were analyzed. (D) Comparison of percentages of total and EGFP(CCR10)+FOXP3+ Treg, and EGFP(CCR10)+FOXP3−CD4+ T cells of the colonic LP of CCR10−/− vs. CCR10+/− mice. N≥7 mice of each genotype were analyzed. (E) Flow cytometric analysis of gated EGFP(CCR10)+CD3−, EGFP(CCR10)+CD3+ and EGFP(CCR10)−CD3+ CD45+ cells of the colons of CCR10+/− mice for CD3 and surface IgA. Representative of more than 10 experiments. (F) Imaging flow cytometric detection of conjugates of EGFP(CCR10)+ IgA-ASCs and EGFP(CCR10)−CD3+ T cells of the colon. Representatives of 30 conjugates. (G) Immunofluorescent microscopic analysis of interaction of IgA-ASCs and FOXP3+ Treg cells in colonic sections. A DAPI-only image is shown besides the image with both DAP1 and antibody staining signals. Note that the IgA+ cell and CD3+Foxp3+ cell indicated by arrows in the inlet have nucleuses based on the DAPI signal. The graph on the right summarizes percentages of FOXP3+ Treg cells and FOXP3− T cells that interact with IgA-ASCs based on the immunofluorescent microscopic analysis. One dot represents one mouse. The line links the data of the same mouse. Total 1196 FOXP3(EGFP)− and 65 FOXP3(EGFP)+ CD3+ T cells of 5 mice were analyzed.

