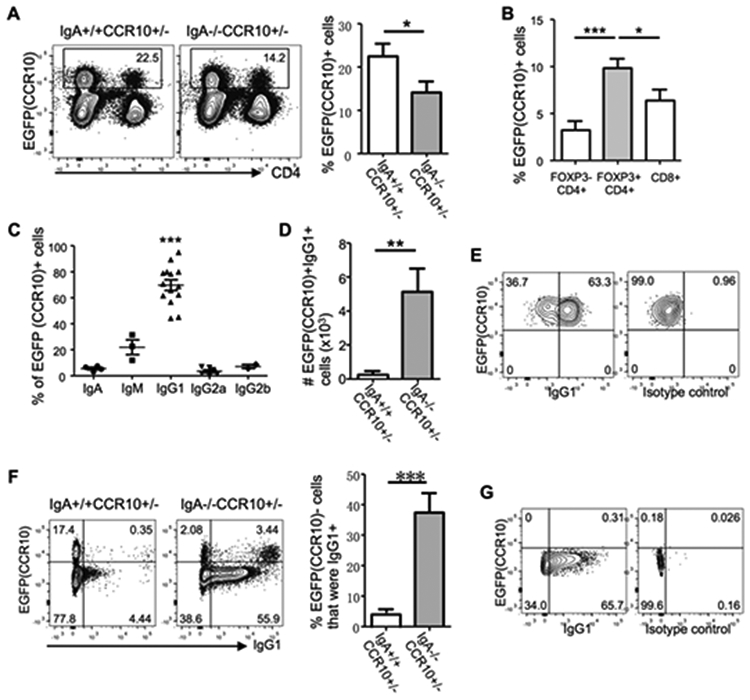
Figure 5.

CCR10+ IgG1-ASCs are the major isotype of ASCs that substitute for CCR10+ IgA-ASCs in the colons of IgA-knockout mice. All mice carried a CCR10-KO/EGFP-KI allele (CCR10+/−) for reporting the CCR10 expression with EGFP. (A) Flow cytometric analysis of gated colonic CD45+ immune cells for EGFP(CCR10)+ plasma cells and their interacting CD4+ T cells in IgA+/+CCR10+/− and IgA−/−CCR10+/− mice. The bar graph on the right shows average percentages of EGFP(CCR10)+ cells of total CD45+ immune cells in the colon of IgA+/+CCR10+/− and IgA−/−CCR10+/− mice. N = 6 mice of each genotype. (B) Average percentages of different subsets of colonic T cells that form conjugates with EGFP(CCR10)+ plasma cells in IgA−/−CCR10+/− mice. 6 mice were analyzed. (C) Average percentages of EGFP(CCR10)+ colonic plasma cells that express indicated antibody isotypes in IgA−/−CCR10+/− mice. One dot represents one mouse. (D) Comparison of the number of EGFP(CCR10)+IgG1+ cells in the colon of IgA+/+CCR10+/− and IgA−/−CCR10+/− mice. 5 mice of each genotype were analyzed. (E) Flow cytometric analysis of gated CD45+EGFP(CCR10)+ colonic plasma cells for their surface expression of IgG1 in IgA−/− CCR10+/− mice. Repeated twice. (F) Flow cytometric analysis of gated colonic CD45+ immune cells for intracellular IgG1 in EGFP+ and EGFP− cells in IgA−/−CCR10+/− and IgA+/+CCR10+/− mice. The bar graph on the right shows percentages of EGFP(CCR10)− IgG1+ cells of total EGFP(CCR10)- immune cells in the colon of IgA+/+CCR10+/− and IgA−/−CCR10+/− mice. 5 mice of each genotype were analyzed. (G) Flow cytometric analysis of gated CD45+F4/80+ cells of IgA−/−CCR10+/− mice for intracellular IgG1. Representative of 3 independent experiments.
