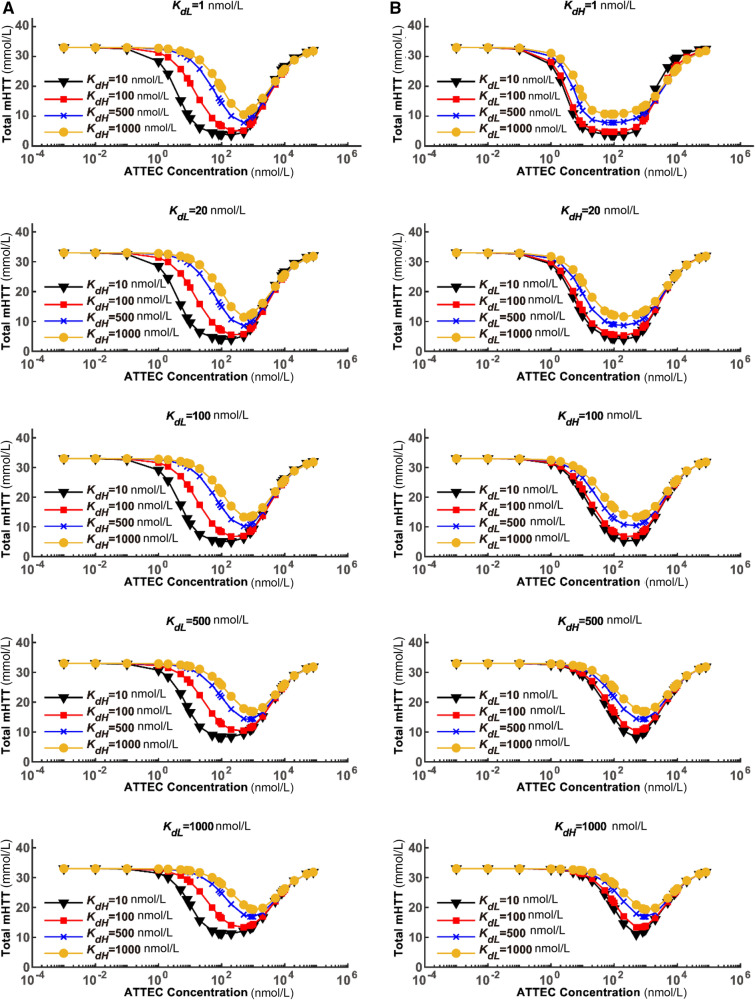
Fig. 1.
Modeling of the dose-dependence curves for the ATTEC with varying Kd values. The relationship between the steady-state concentrations of total mHTT and the concentrations of ATTEC molecules are shown. A The ATTEC dose-dependence curves with a set of KdH values and a fixed KdL in each panel. B Similar to A, but with a set of KdL values and a fixed KdH in each panel. The KdL and KdH values are set to a series of representative numbers that are easy for calculation and covering the range of our previously-discovered ATTECs.

