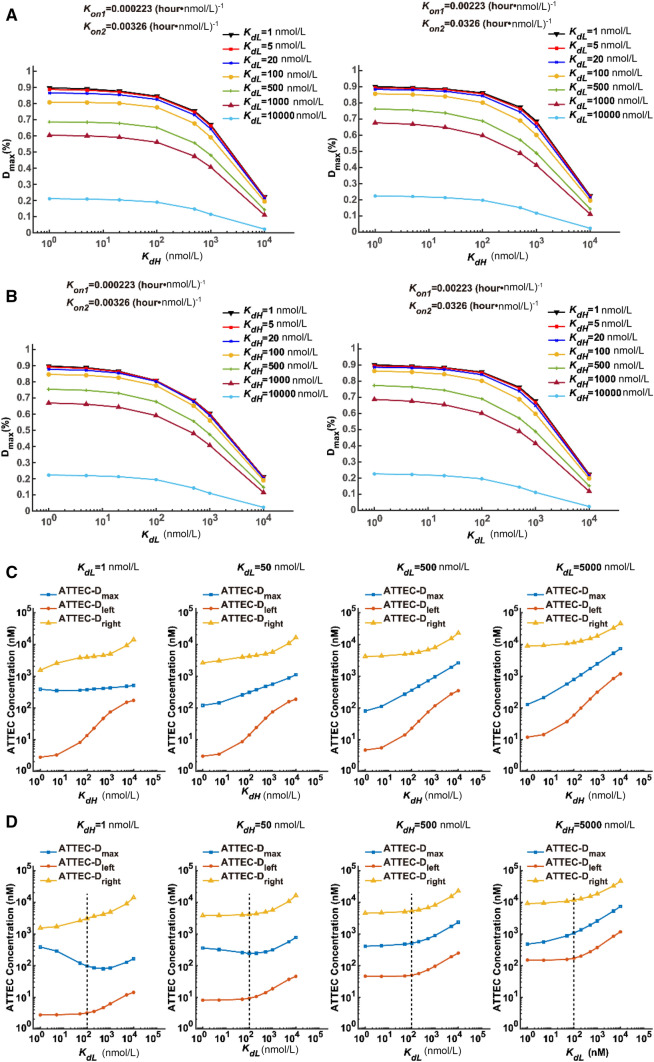
Fig. 2.
The relationship between the degradation effect (Dmax and the effective concentration range) and the compound–protein affinity (KdL and KdH). A Simulated Dmax–KdH relationship assuming the indicated KdL values. B Simulated Dmax–KdL relationship assuming the indicated KdH values. C, D Plots of concentrations needed to achieve maximum degradation ATTEC–Dmax or half-maximum degradation ATTEC–Dleft and ATTEC–Dright at different sets of KdL and KdH values. C ATTEC–Dmax, ATTEC–Dleft, and ATTEC–Dright concentrations assuming different KdH values at a fixed KdL in each panel. D Similar to C, but assuming different KdL values at a fixed KdH in each panel. Dashed lines indicate 100 nmol/L, below which KdL has little influence on the effective concentration range. The KdL and KdH values were set to a series of representative numbers that are easy for calculation and covering the range of our previously-discovered ATTECs.

