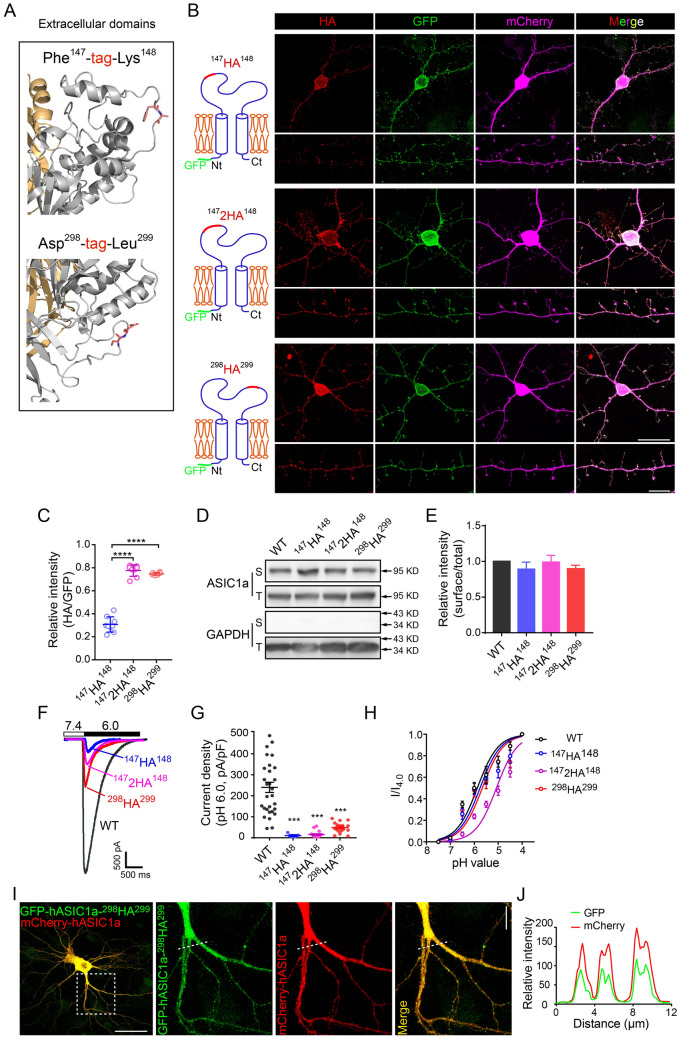
Fig. 1.
Screening extracellular HA-tagged hASIC1a for surface staining. A Candidate sites for epitope tag insertion in the extracellular loop of hASIC1a. Based on the high-resolution structure, two exposed flexible sites were chosen for epitope insertion, the first between Phe147 and Lys148 (upper panel) and the second between Asp298 and Leu299 (lower panel). B Representative images of surface staining by HA (red) and total hASIC1a expression by GFP (green) in Asic1a−/− mouse cortical neurons that expressed different HA-tagged GFP-hASIC1a as indicated at left. mCherry was co-transfected to indicate neuronal morphology (magenta). Scale bars: upper panel, 20 μm; lower panel, 10 μm. C Quantification of surface hASIC1a labeling in neurons based on HA/GFP fluorescence intensity ratio. Data are presented as the mean ± SEM. The ratios for 1472HA148 (0.775 ± 0.018, n = 8 cells) and 298HA299 (0.747 ± 0.005, n = 6 cells) are higher than that for 147HA148 (0.307 ± 0.022, n = 9 cells). ****P < 0.0001, no significant difference between 1472HA148 and 298HA299, one-way ANOVA multiple comparison. D, E Representative blots (D) and quantification (E) of surface (biotinylated, S) and total (T) hASIC1a in CHO cells that expressed WT and the three HA-tagged hASIC1a as indicated. GAPDH was used as a cytoplasmic protein control. The normalized surface/total ratios are presented as the mean ± SEM: 147HA148, 0.89 ± 0.10; 1472HA148, 0.99 ± 0.10; 298HA299, 0.90 ± 0.05. No significant difference between WT and any HA-tagged hASIC1a, one-way ANOVA multiple comparison, n = 3 experiments. F Representative traces of acid (pH 6.0)-activated currents recorded from CHO cells transfected with WT or HA-tagged hASIC1a as indicated. Cells were held at −60 mV; baseline pH was 7.4. G Quantification of peak current density. Data are presented as the mean ± SEM. The density of I6.0 (pA/pF) for 147HA148 (10.92 ± 3.80, n = 9 cells), 1472HA148 (15.46 ± 3.57, n = 19 cells), and 298HA299 (48.78 ± 6.54, n = 18 cells), is lower than that of WT hASIC1a (259.5 ± 26.61, n = 29 cells). ***P < 0.001, one-way ANOVA multiple comparison. H pH dose-response curves for WT and HA-tagged hASIC1a (normalized to current elicited by pH 4.0 solution). To ensure that the channels were not desensitized before stimulation, the baseline pH was 9.0. pH50 (data are presented as the mean ± SEM): WT, 6.13 ± 0.05 (n = 13 cells); 147HA148, 5.78 ± 0.06 (n = 13 cells); 1472HA148, 5.13 ± 0.04 (n = 15 cells); and 298HA299, 5.67 ± 0.08 (n = 12 cells). I, J GFP-hASIC1a-298HA299 displays the same localization as WT hASIC1a (represented by mCherry-hASIC1a). GFP-hASIC1a-298HA299 and mCherry-hASIC1a were co-transfected into Asic1a−/− neurons. I Representative images of GFP and mCherry, showing excellent co-localization with a Pearson’s coefficient (r) of 0.917. Scale bars: left panel, 50 μm; right panel, 10 μm. J Intensity plots for the line profile of GFP and mCherry along the dashed lines shown in (I).

