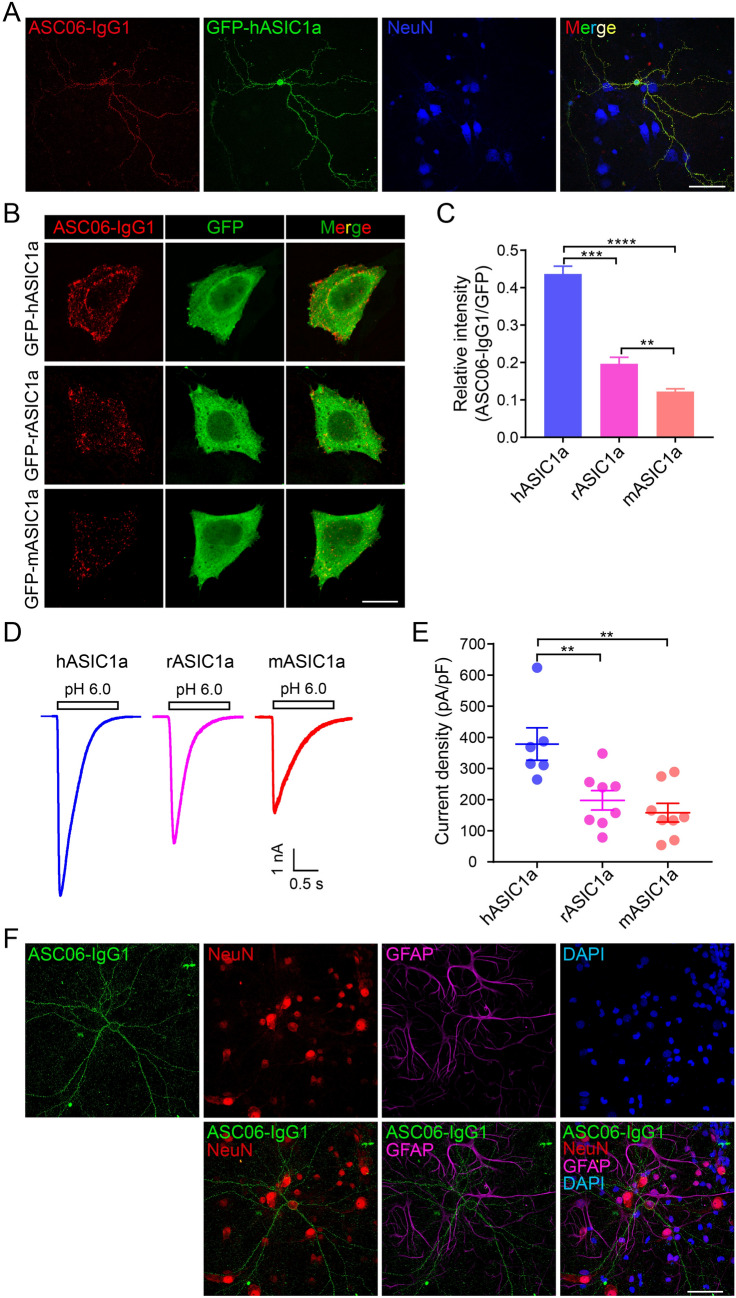
Fig. 3.
Specificity of the novel antibody against the hASIC1a ectodomain. A Verification of antibody specificity in neurons by surface staining with ASC06-IgG1 in Asic1a−/− neurons transfected with GFP-hASIC1a. Fluorescent signal of surface hASIC1a occurs only in the transfected neuron. Scale bar, 50 μm. B, C Species specificity of ASC06-IgG1 against ASIC1a tested by transfecting CHO cells with GFP-tagged hASIC1a, rASIC1a, or mASIC1a and surface staining with ASC06-IgG1. B Representative images of surface staining (red) and total ASIC1a expression (green) (scale bar, 20 μm). C Quantification of surface labeling based on ASC06-IgG1/GFP fluorescence intensity ratios. Data are presented as the mean ± SEM. [hASIC1a, 0.44 ± 0.02 (n = 11 cells); rASIC1a, 0.20 ± 0.02 (n = 9 cells); mASIC1a, 0.12 ± 0.01 (n = 13 cells); **P < 0.01, ***P < 0.001, ****P < 0.0001, one-way ANOVA multiple comparison]. D, E Acid-activated current of GFP-hASIC1a, -rASIC1a, or -mASIC1a expressed in CHO cells. Cells were transfected with the same amount of cDNA for the three orthologs followed by whole-cell recording of I6.0. D Representative I6.0 traces. E Quantification of current density of peak I6.0 (pA/pF). Data are presented as the mean ± SEM. [hASIC1a, 378.47 ± 52.22 (n = 6 cells); rASIC1a, 197.73 ± 31.30 (n = 8 cells); mASIC1a, 157.98 ± 30.15 (n = 8 cells), **P < 0.01, no significant difference between rASIC1a and mASIC1a, one-way ANOVA multiple comparison]. F Endogenous rASIC1a detected by ASC06-IgG1 in primary cultures of rat cortical neurons immunostained at DIV 18 with ASC06-IgG1 (green) under non-permeabilized conditions; neurons were then stained with the neuronal marker NeuN (red), astrocyte marker GFAP (magenta), and nuclear maker DAPI (blue) (scale bar, 50 μm).

