Fig. 4.
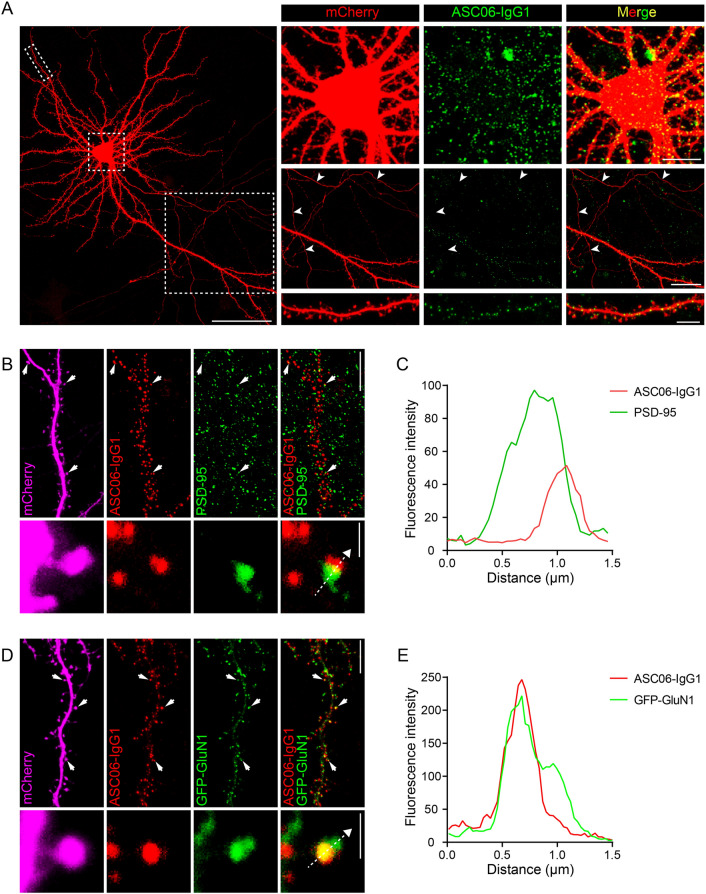
Plasma membrane distribution of neuronal hASIC1a labeled by the hASIC1a ectodomain antibody. A Representative images of neuronal surface hASIC1a stained by antibody ASC06-IgG1. Surface labeling by ASC06-IgG1 (green) and immunostaining for mCherry (red) in Asic1a−/− neurons co-transfected with hASIC1a and mCherry. Boxed areas are enlarged to show the location of surface hASIC1a in soma, axon and dendrite. Arrowheads indicate axons; scale bars: left, 50 μm; top right, 10 μm; middle right, 20 μm; bottom right, 5 μm. B, C Relative localization of surface hASIC1a with PSD-95. B A representative dendrite segment and a magnified spine with surface staining by ASC06-IgG1 (red) and immunostaining for PSD-95 (green) and mCherry (magenta) in an Asic1a−/− neuron co-transfected with mCherry and hASIC1a. Scale bars: upper right, 10 μm; lower right, 1 μm. C Plot for the line profile of ASC06-IgG1 (red) and PSD-95 (green) along the dashed lines in the spine shown in (B). D, E Relative localization of surface hASIC1a with GluN1. D A representative dendrite segment and a magnified spine with surface staining by ASC06-IgG1 (red) and immunostaining for GFP-GluN1 (green) and mCherry (magenta) in an Asic1a−/− neuron co-transfected with hASIC1a, GFP-GluN1 and mCherry. Scale bars: upper right, 10 μm; lower right, 1 μm. E Plot for the line profile of ASC06-IgG1 (red) and GFP-GluN1 (green) along the dashed line in the spine shown in (D).

