Fig. 5.
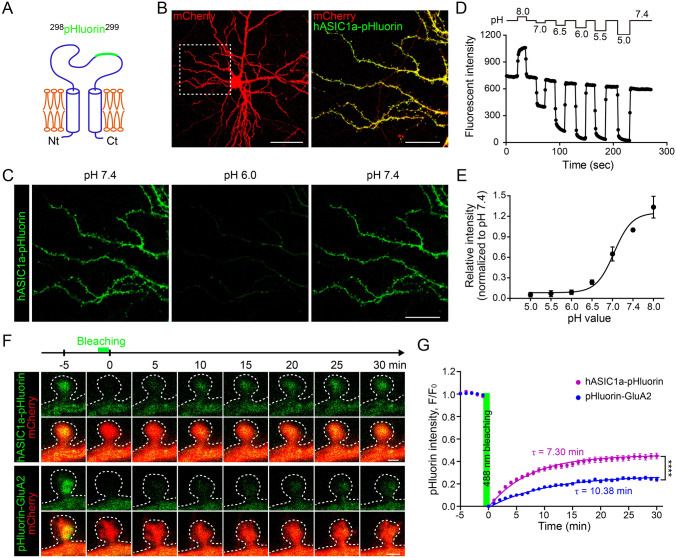
Membrane trafficking of hASIC1a in dendritic spines of live neurons. A Diagram of ex-tagged hASIC1a-298pHluorin299; pHluorin is inserted between Asp298 and Leu299 of the hASIC1a extracellular loop. B Representative images of the expression and distribution of hASIC1a-pHluorin in Asic1a−/− neurons. hASIC1a-pHluorin and mCherry were co-transfected into ASIC1a-null neurons and images were captured under live condition at DIV 18. Scale bars: left panel, 50 μm; right panel, 20 μm. C Representative images showing the pH sensitivity of hASIC1a-298pHluorin299 fluorescence. Asic1a−/− neurons transfected with hASIC1a-298pHluorin299 were perfused back and forth with solutions of pH 7.4 and 6.0 as indicated. Scale bar: 20 μm. D hASIC1a-298pHluorin299 fluorescence intensity in extracellular solutions (ECS) of pH 8.0, 7.4, 7.0, 6.5, 6.0, 5.5, and 5.0 as indicated. E pH dose-response curve of hASIC1a-298pHluorin299 fluorescence. Data points represent the mean ± SEM of n = 9 neurons and are fitted with the Hill equation to yield an IC50 of pH 5.08. F, G Membrane trafficking of pHluorin-GluA2 and hASIC1a-298pHluorin299 in excitatory synapses. F Representative time-lapse images of FRAP in dendritic spines of WT rat neurons transfected with mCherry plus pHluorin-GluA2 or hASIC1a-298pHluorin299. After 5 min of baseline recording, the spine head is bleached with the 488 nm laser for 1 min, followed by another 30 min of recording. Scale bars: 0.5 μm. G Quantification of pHluorin fluorescence recovery. At 30 min, the fluorescence returns to 44.87 ± 2.53% (n = 54 spines) of baseline for hASIC1a-298pHluorin299 and 23.85 ± 1.40% (n = 49 spines) for pHluorin-GluA2. Data points represent the mean ± SEM, and those after bleaching are fitted with an exponential function which yields the solid lines and τpHluorin-GluA2 = 10.38 min and τhASIC1a-pHluorin = 7.30 min. ****P < 0.0001, two-way ANOVA multiple comparisons.

