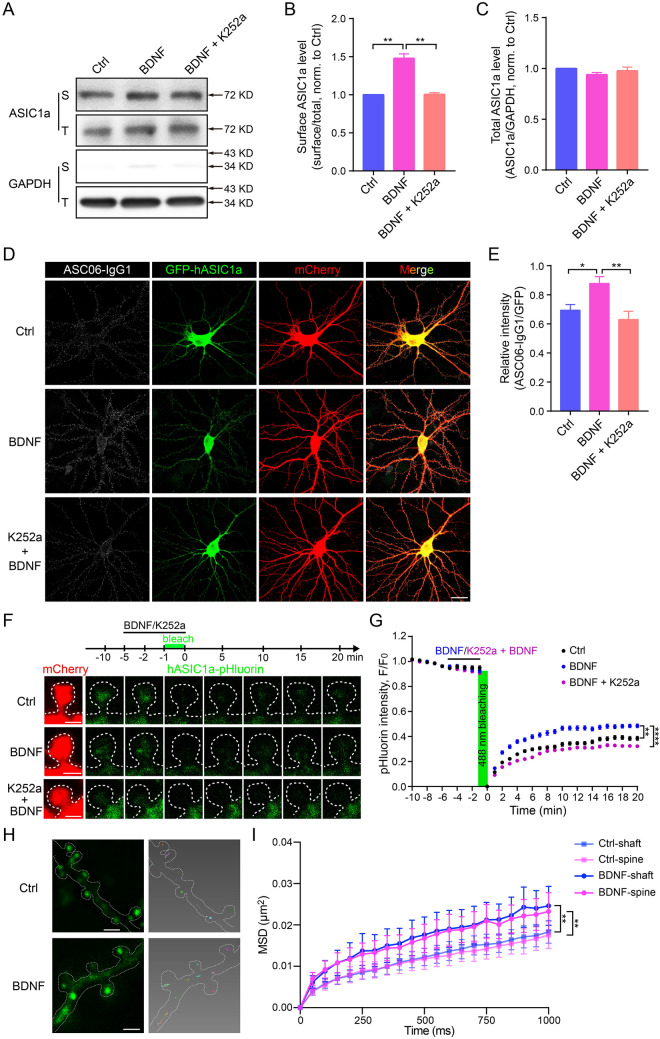
Fig. 7.
Enhanced spatiotemporal dynamics of neuronal surface ASIC1a underlying BDNF treatment. A–C Cultured rat cortical neurons treated with vehicle (Ctrl), BDNF (20 ng/mL) or BDNF plus the pan-Trk inhibitor, K252a (200 nmol/L) for 5 min before surface biotinylation. A Representative blots of surface (biotinylated, S) and total (T) ASIC1a, with GAPDH as a cytoplasmic protein control. B Quantification of surface ASIC1a levels by S/T ratio (normalized to Ctrl). Data are presented as the mean ± SEM. [BDNF/Ctrl, 1.48 ± 0.02; BDNF/(K252a + BDNF), 1.47 ± 0.01; (K252a + BDNF)/Ctrl, 1.00 ± 0.02, **P < 0.01, n = 4 experiments, no significant difference between Ctrl and BDNF + K252a, one-way ANOVA multiple comparison]. C Quantification of total ASIC1a levels by ASIC1a/GAPDH ratio (normalized to Ctrl). Data are presented as the mean ± SEM. [BDNF/Ctrl, 0.94 ± 0.01; BDNF/(K252a + BDNF), 0.96 ± 0.04; (K252a + BDNF)/Ctrl, 0.98 ± 0.02, n = 4 experiments, no significant difference between any two groups, one-way ANOVA multiple comparison. D, E Asic1a−/− neurons co-transfected with GFP-hASIC1a and mCherry were treated with vehicle, BDNF, or BDNF plus K252a as above before surface staining. D Representative images of surface hASIC1a stained by ASC06-IgG1, as well as that of total hASIC1a by GFP and neuron morphology by mCherry (scale bar, 20 μm). E Quantification of surface hASIC1a level based on ASC06-IgG1/GFP intensity ratio. Data are presented as the mean ± SEM. [Vehicle, 0.69 ± 0.05 (n = 11 neurons); BDNF, 0.88 ± 0.05 (n = 10 neurons); BDNF + K252a, 0.63 ± 0.06 (n = 8 neurons), *P < 0.05, **P < 0.01, no significant difference between Ctrl and BDNF + K252a, one-way ANOVA multiple comparison. F, G FRAP assays of dendritic spines of Asic1a−/− neurons co-transfected with mCherry and hASIC1a-298pHluorin299. After 5 min of baseline recording, neurons were perfused with ECS containing vehicle, BDNF, or BDNF plus K252a for another 5 min. Then a selected mushroom spine head was bleached with the 488 nm laser for 1 min, followed by another 20 min of recording. F Representative time-lapse images (scale bars, 1 μm). G Quantification of FRAP. After 20 min of recovery, the pHluorin fluorescence returns to 40.20 ± 1.66% (n = 122 spines) of baseline for Ctrl, 49.98 ± 1.48% (n = 100 spines) for BDNF, and 32.22 ± 1.05% (n = 134 spines) for K252a + BDNF. Data points represent the mean ± SEM, **P < 0.01, ****P < 0.0001, no significant difference between Ctrl and BDNF + K252a, two-way ANOVA multiple comparison. H, I Effect of BDNF on lateral mobility of surface hASIC1a in dendritic shafts and spines. H Representative images and reconstructed trajectories of surface hASIC1a SPT (scale bars, 1 μm). I MSD versus time plot for the mobility of surface hASIC1a puncta on dendritic shafts and spines with or without BDNF treatment. Data points represent the mean ± SEM, n = 19 cells for Ctrl and n = 21 cells for BDNF-treated. Paired t test on area under the curve showed no significant difference between shafts and spines in either the Ctrl or BDNF treatment group, but **P < 0.01 for Ctrl versus BDNF-treated at either shafts or spines.

