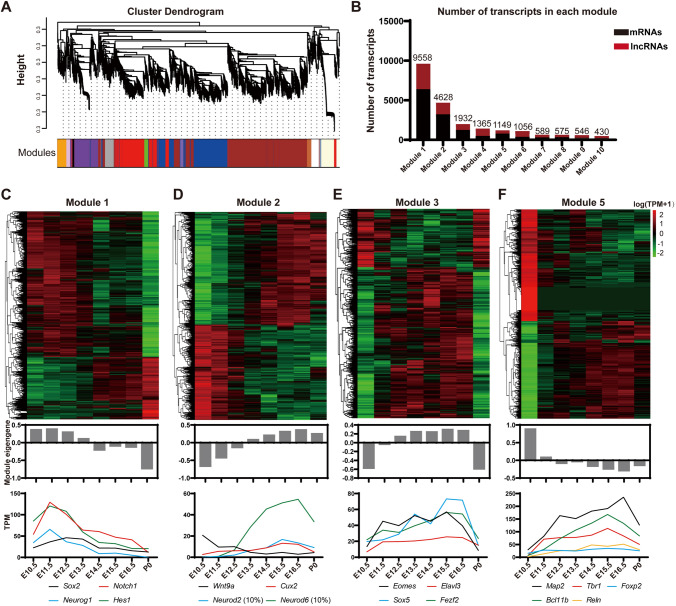
Fig. 2.
Co-expression modules categorize transcripts implicated in cortical development. A Hierarchical cluster dendrogram of co-expression modules for lncRNA genes and mRNA genes. A total of 46 modules are labeled with different color bands beneath corresponding tree branches. B Numbers of mRNAs and lncRNAs in Module 1–10. C–F Heatmaps and Eigengene bar plots of four modules. Upper panels: expression levels of lncRNAs and PCGs normalized to log10 (TPM+1) (red, higher expression; black, neutral expression; green, lower expression); middle panels: module Eigengene barplots representing expression levels of all transcripts, calculated by moduleEigengenes in the WGCNA package and in line with the first principal component obtained by singular value decomposition of each module: lower panels: broken line graphs exhibit expression patterns of representative protein-coding genes.

