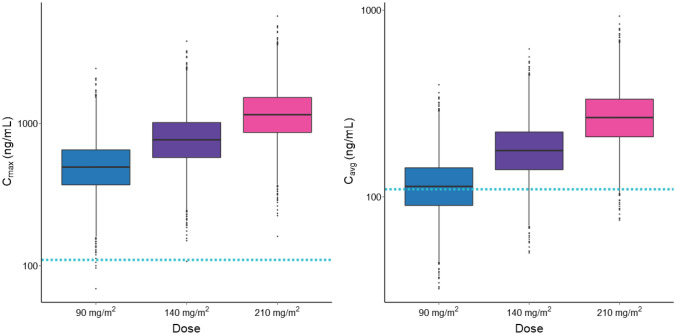
Fig. 3.
Distribution of simulated exposure metrics following berzosertib recommended dose for different combination regimens. Cmax maximum concentration, Cavg average concentration. Distributions of simulated Cmax (left) and Cavg (right) following berzosertib single dose of 90 mg/m2 (recommended dose for the combination with carboplatin), 140 mg/m2 (recommended dose for the combination with cisplatin), and 210 mg/m2 (recommended dose for the combination with gemcitabine). Boxes represent interquartile range; horizontal lines are first quartiles, medians, third quartiles; lower whiskers extend from each quartile to the extreme non-outlier values in the dataset; points are outliers. The blue horizontal dashed line represents the p-Chk1 IC50

