Fig. 2.
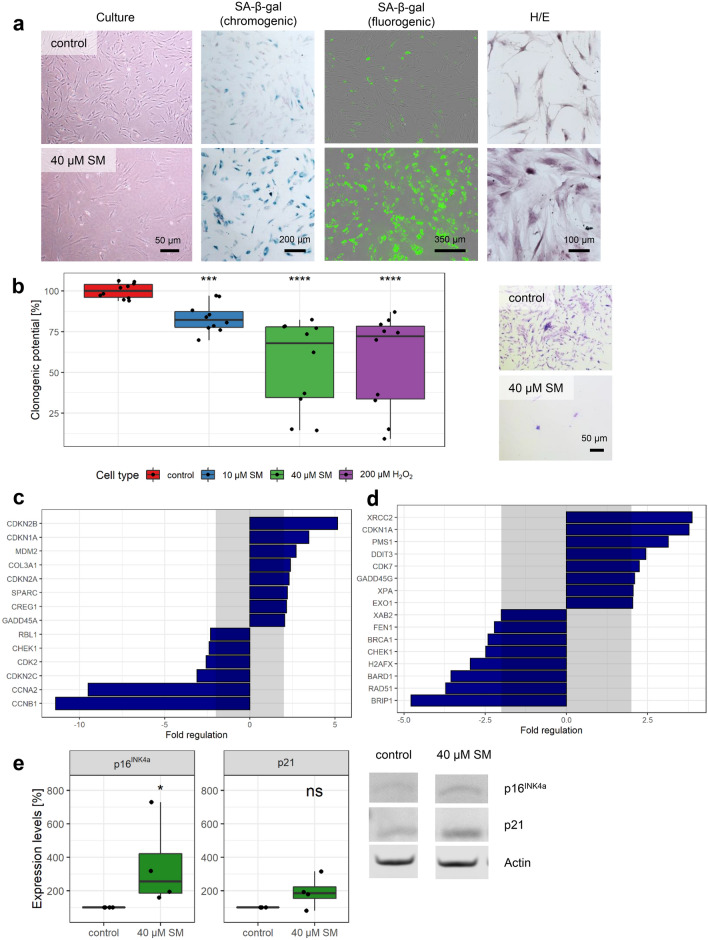
Senescence markers. a Representative images from both chromogenic (PromoCell) and fluorogenic (Cell Biolabs) SA-β-gal staining in MSCs 21 days after 40 µM SM exposure show a very high percentage of senescent cells with high staining intensity compared to solvent controls. Flattening and enlargement shown already in culture as well as by hematoxylin/eosin (H/E) staining. b Loss of replicative potential shown by clonogenicity assay. Colonies formed and stained with crystal violet could be observed for controls, but only single cells for 40 µM SM senescent cells. After destaining with methanol, crystal violet absorbance examined at 570 nm by plate reader and mean of controls set to 100% (n = duplicates per group from five independent experiments). Genes associated with c senescence biomarkers or d DNA damage and DNA repair were tested 21 days after 40 µM SM exposure and compared to controls. After RNA extraction from MSCs, a RT-qPCR assay was performed and fold regulation of up- or downregulated genes (≥ 2.0 or ≤ − 2.0 in combination with p < 0.05, outside grey box) are shown as means (n = three independent experiments). e The upregulation of p16INK4a and p21 was also observed using Western Blot. Representative bands and expression levels are shown (n = four independent experiments). Data are represented as Tukey boxplots; *p < 0.05, **p < 0.01, ***p < 0.001, ****p < 0.0001. See also Supplementary Fig. 4

