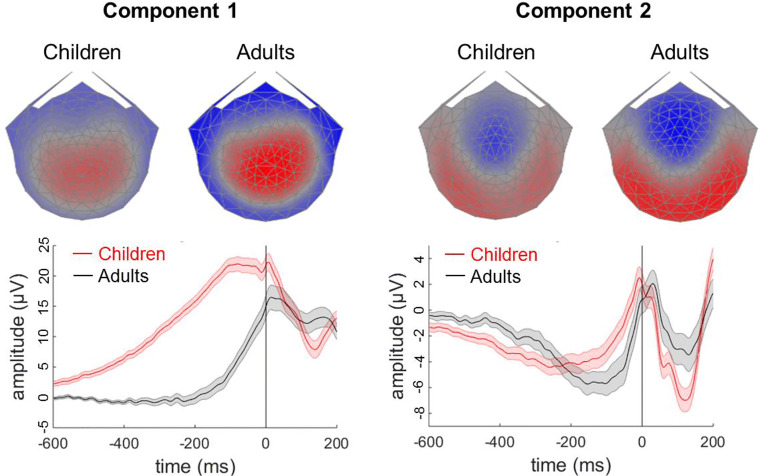
Fig. 4.
Scalp topographies and component grand average waveforms for response-locked reliable components 1 and 2. Topographic visualisations of the forward-model projections of components 1 and 2 (upper panel) reflecting the weights given to each electrode following RCA for children and adult participants (upper panels). The grand average waveforms (lower panel) show the data multiplied by these spatial weights, for children (red) and adults (black). Shaded error bars represent the standard error of the mean

