
Fig. 9.
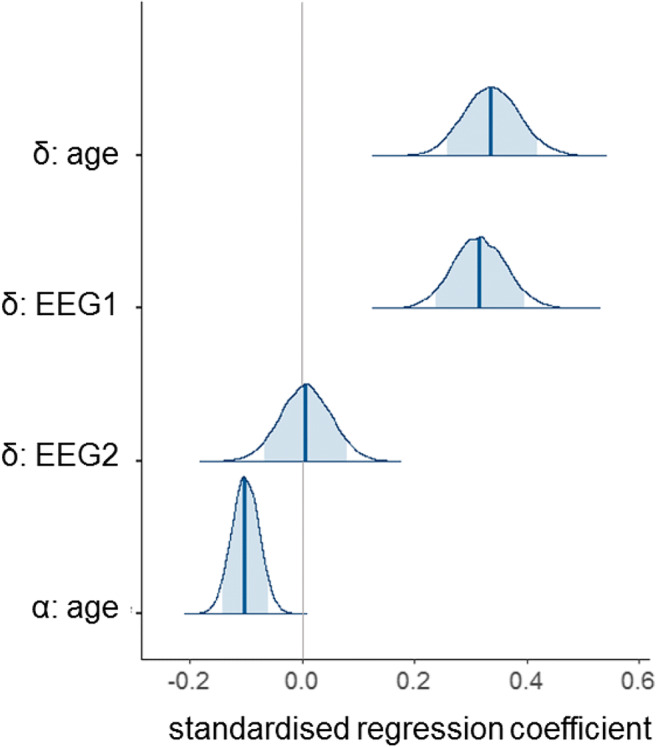
Posterior distributions of estimated standardised regression coefficients from model 10 fit to children’s data. Posterior distributions of the four standardised regression coefficients in model 10: age, EEG component 1 (EEG1) and EEG component 2 (EEG2) covarying with drift-rate (δ), and age covarying with boundary separation (α). The thick lines represent the median point estimate, and the shaded regions represent the 90% probability mass