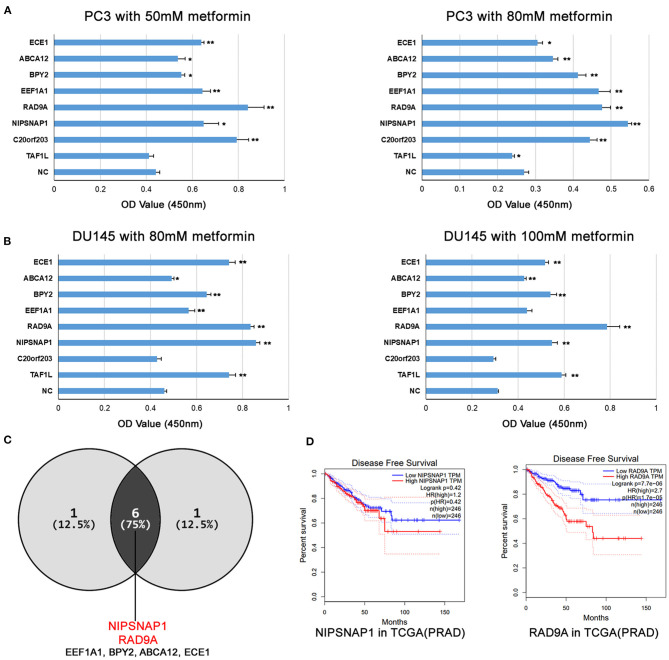
Figure 3.
The overexpression of the candidate genes increases metformin resistance in PCa cell lines. (A,B) PC3 and DU145 cell lines with single gene overexpression were treated with the indicated doses of metformin for 24 h, and cell viability was measured using a CCK8 assay. Data were represented as mean ± SEM of a representative experiment. (C) The Venn diagram shows that the candidate genes increases metformin resistance in PC3 and DU145. (D) Disease Free Survival analysis of RAD9A and NIPSNAP1 in TCGA-PRAD dataset.

