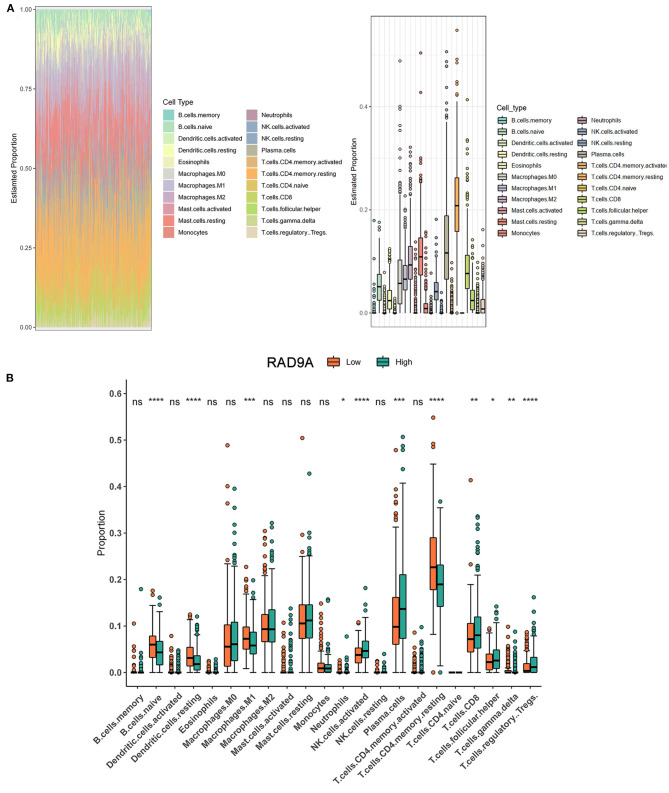
Figure 6.
Intratumoral immune cell composition analysis. (A) The proportion of 22 immune cell types in prostate cancer from TCGA datasets. (B) The boxplot shows the different infiltration levels of 22 immune cell types between the high and low RAD9A expressions. *P < 0.05; **P < 0.01; ***P < 0.001. ****P < 0.0001.

