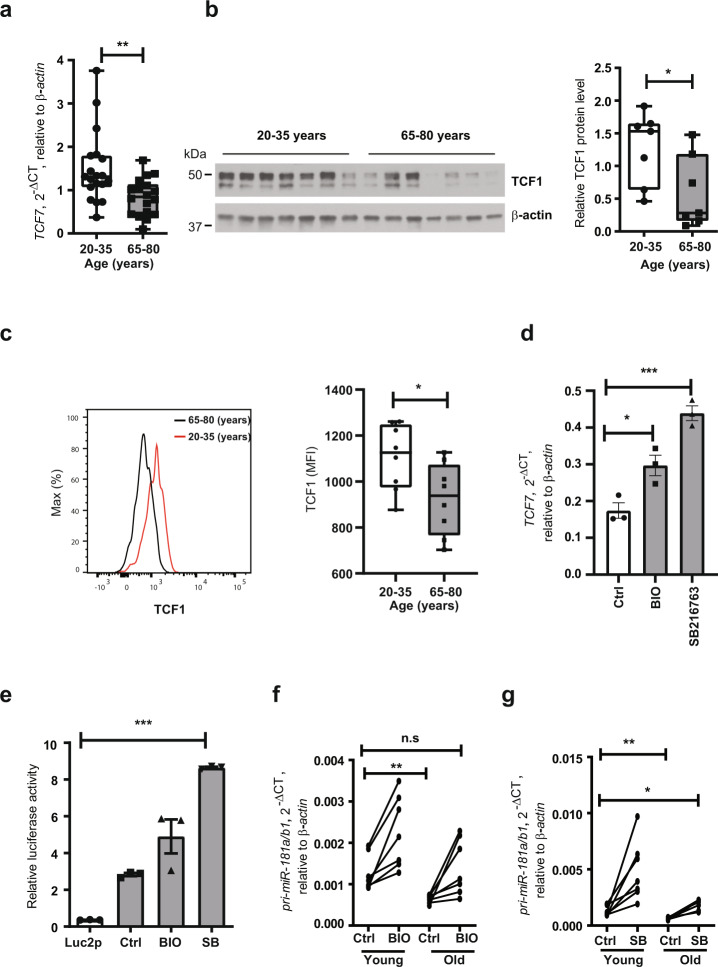
Fig. 2. Restoration of miR-181a expression in old naive CD4 T cells by inducing TCF1 activity.
a TCF7 transcripts in naive CD3 + CD4 + CD45RO- T cells were quantified by qPCR. Results for 20–35 (n = 19) and 65–85 (n = 18) year-old individuals are shown as box plots of TCF7 transcripts relative to ACTB. b TCF1 protein levels in CD3 + CD4 + CD45RO- naive T cells from seven young and seven old adults are shown as Western blots (left) and box plots of relative densities (right). Uncropped Western blots in Supplementary Figure 4. All samples in the blot derive from the same experiment and were processed in parallel. c TCF1 expression levels in naive T cells from eight young and eight old adults are shown as representative histograms (left) and summary box plots (right). d Naive CD4 T cells from old individuals were treated with GSK3β inhibitors 6-bromoindirubin-3-oxime (BIO) or SB216763 for 48 h. TCF7 transcripts quantified by qPCR are shown as mean±SEM (n = 3). e BIO (1 µM) or SB216763 (5 µM) were added to HEK293T cells transfected with pri-miR-181a enhancer reporter constructs 12 h after transfection. Reporter activities after 48 h are shown as mean±SEM (n = 3). f, g Naive CD4 T cells from seven young and seven old individuals were cultured with DMSO solvent control or BIO (f, 1 µM) or SB216763 (g, 5 µM) for 48 h. Pri-miR-181a/b1 transcripts were quantified by qPCR. Comparisons were done by two-tailed unpaired t test in a, b, c, f, and g; or by one-way ANOVA with post-hoc Tukey test in d, e. Significance levels are indicated as *P < 0.05, **P < 0.005, ***P < 0.0001.

