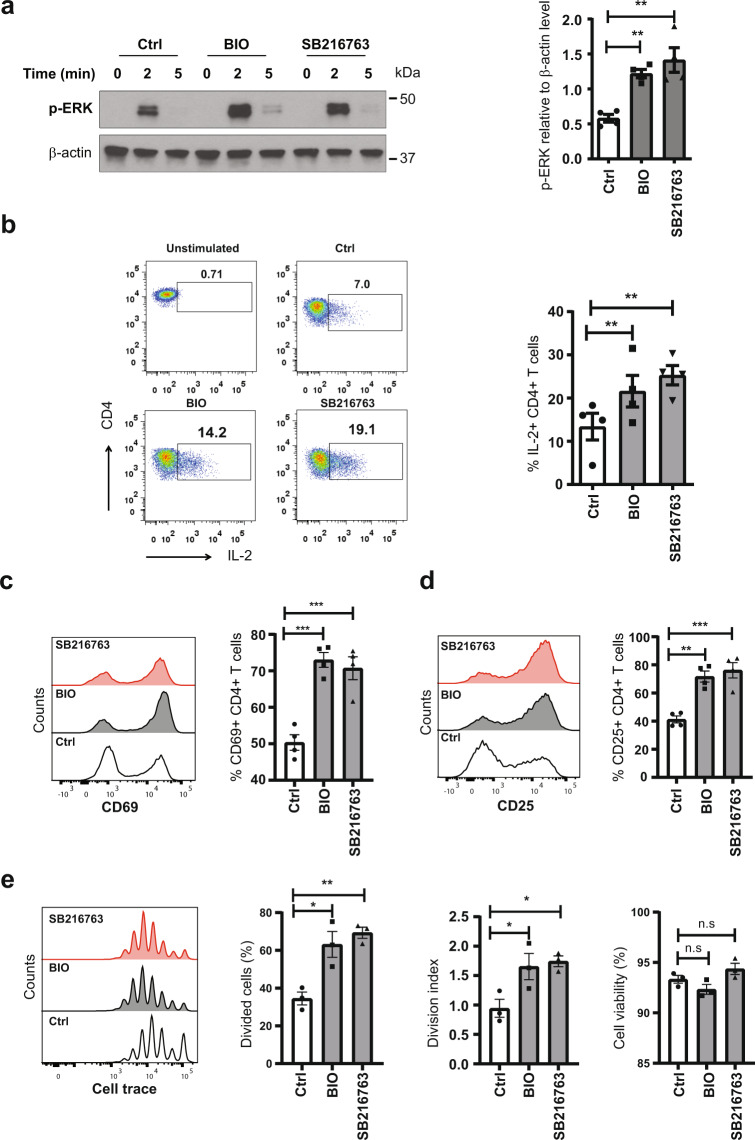
Fig. 3. GSK3β inhibition enhances TCR signaling in T cells from old individuals.
a Naive CD4 T cells from old adults were pre-treated with DMSO solvent control or GSK3β inhibitors BIO (1 µM) or SB216763 (5 µM) for 48 h and then stimulated by CD3/CD28 cross-linking. Representative immunoblots of pERK (Thr202/Tyr204) at indicated time points (left) and mean±SEM of pERK relative to β-actin levels at 2 min (n = 4, right) are shown. Uncropped Western blots in Supplementary Fig. 4. All blots derive from the same experiment and were processed in parallel. b Naive CD4 T cells from old adults were pre-treated with 1 µM BIO or 5 µM SB216763 for 48 h; cells were washed once in PBS, seeded into 48-well plates, and stimulated with Dynabeads at a bead-to-cell ratio of 1:2 for 24 h, and GolgiPlug was added for the last 8 h. Intracellular cytokine staining for IL-2 production is shown as representative scatter plots (left) and frequencies of IL-2-producing cells are shown as mean±SEM (n = 4, right). c–e Naive CD4 T cells from old adults were pre-treated with 1 µM BIO or 5 µM SB216763 and cultured for 24 h (CD69), 48 h (CD25), or 5 days (proliferation) in plates coated with CD3/CD28 antibodies. c CD69 expression is shown as representative histograms (left) and frequencies of CD69 are shown as mean±SEM (n = 4, right). d CD25 expression is shown as representative histograms (left) and frequencies of CD25 are shown as mean±SEM (n = 4, right). e Cell proliferation is shown as representative histograms (left); cell proliferation index and cell viability are shown as mean±SEM (n = 3, right). Comparisons were done by one-way ANOVA with post-hoc Tukey test. Significance levels are indicated as *P < 0.05, **P < 0.005, ***P < 0.0001.

