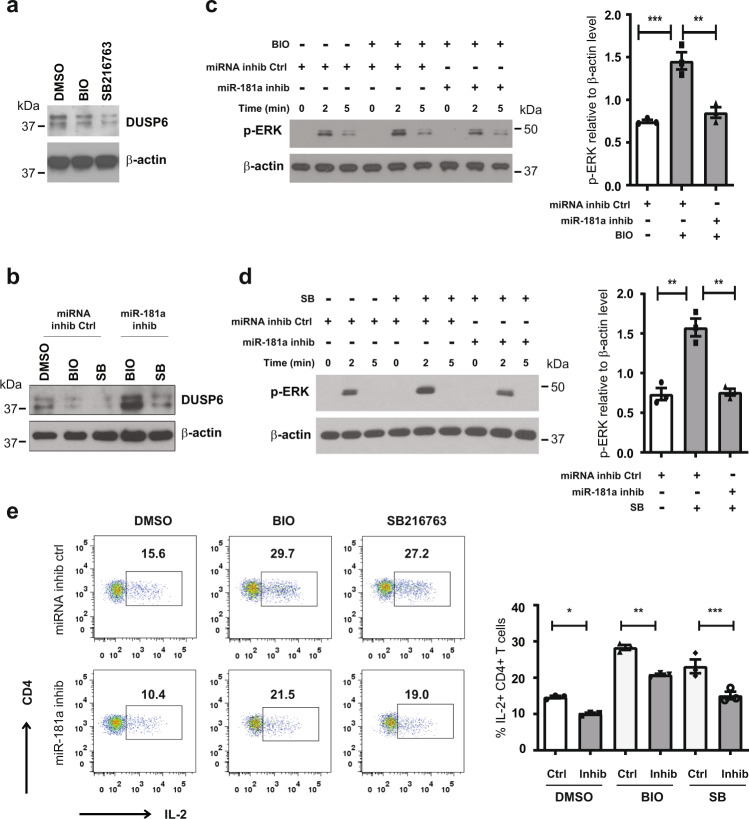
Fig. 4. GSK3β inhibitors regulate T cell receptor signaling and T cell activation through controlling miR-181a expression.
a Naive CD4 T cells were treated with GSK3β inhibitors BIO (1 µM) or SB 216763 (5 µM) for 48 h. Cell lysates were subjected to Western blotting for the miR-181a target DUSP6. β-actin was used as loading control. Data are representative of two experiments. b Naive CD4 T cells were transfected with miR-181a inhibitor or miRNA inhibitor negative control and then cultured and analyzed for the expression of DUSP6 after culture with GSK3ß inhibitors as described in (a). Data are representative of two experiments. c, d Naive CD4 T cells, transfected with miR-181a inhibitor or miRNA inhibitor negative control, were treated with GSK3β inhibitors BIO (c, 1 µM) or SB 216763 (d, 5 µM) as described above. Immunoblots of pERK signals (Thr202/Tyr204) at indicated times after CD3/CD28 cross-linking (left) and mean±SEM of pERK relative to β-actin levels at 2 min (n = 3, right) are shown. Uncropped Western blots in Supplementary Fig. 4. All samples in a blot derive from the same experiment and were processed in parallel. e Naive CD4 T cells, transfected with miR-181a inhibitor or miRNA inhibitor negative control, were pre-treated with DMSO, 1 µM BIO, or 5 µM SB216763 as described above. Intracellular cytokine staining for IL-2 is shown as representative scatter plots (left) and mean frequencies±SEM of IL-2-producing cells of three experiments (right). Comparisons were done by one-way ANOVA with post-hoc Tukey test. Significance levels are indicated as *P < 0.05, **P < 0.005, ***P < 0.0001.

