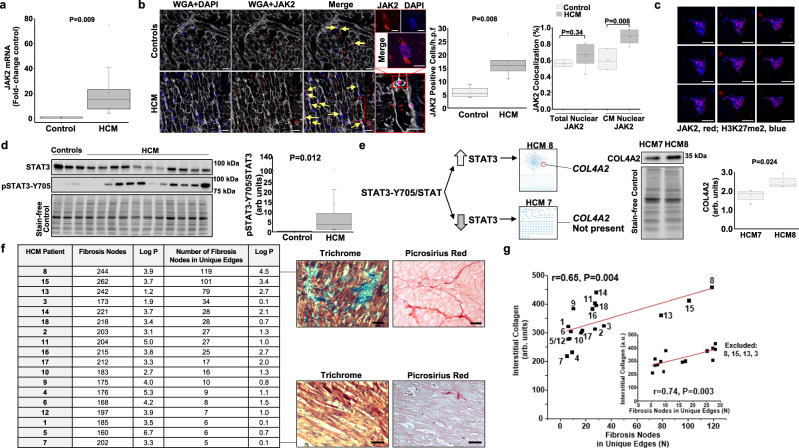
Fig. 3. Individual-patient network features inform the HCM fibrosis pathophenotype.
Janus kinase-2 (JAK2) was one of four profibrotic nodes differentially expressed between HCM and control patients that was also present in all HCM patient networks. a In left ventricular (LV) homogenates, JAK2 mRNA quantity was increased significantly in HCM (N = 16) compared with control (N = 3), b which was consistent with anti-JAK2 immunofluorescence demonstrating increased JAK2-positivity of cells (yellow arrows), c as well as increased nuclear JAK2 expression in cardiomyocytes (supported by Z-stack imaging) (N = 3 for controls; N = 7 for HCM). WGA, wheat germ agglutinin; H3K27me2, methylated lysine 27 of histone H3, and DAPI show nuclear signal. Scale bar = 20 µm, and 6 µm for inset/Z-stack images. d Increased LV homogenate p-STAT3-Y705/total STAT3 was observed in HCM (N = 11) compared with control (N = 3). HCM patients 8 and 7 had the greatest and least p-STAT3-Y705/total STAT3 ratio, respectively, and the STAT3 collagen target COL4A2 was present in the HCM8 network, but absent from the HCM7 network. e Analysis of collagen gene variants suggested a particular difference between HCM8 and HCM7 for COL4A-218, which was confirmed by immunoblot. Immunoblot images are within the same blot, but cropped and merged (N = 4 samples/condition). f The total number of fibrosis nodes and the number (N) of fibrosis nodes in edges unique to a single HCM patient network were calculated. Histopathology confirmed that HCM8 and HCM7 represent extreme fibrosis pathophenotypes. Scale bar = 50 µm. g The relationship between the number of unique fibrosis edges for each patient network and interstitial collagen quantity by trichrome stain, which was maintained after excluding the most densely connected patient networks (N = 4 removed from analysis, shown in inset). The HCM patient number is provided with each datapoint. Representative micrographs and blots are shown. a–e, g Student’s unpaired two-tailed t test or Mann–Whitney tests were used as appropriate. a, b, d, e box plots: mean (square), median (horizontal line), interquartile range (box distribution), and maximum and minimum (stars). f The one-tail hypergeometric test was used to generate the log P values. g For linear regression, Pearson’s correlation coefficient is presented. Source data are available.

