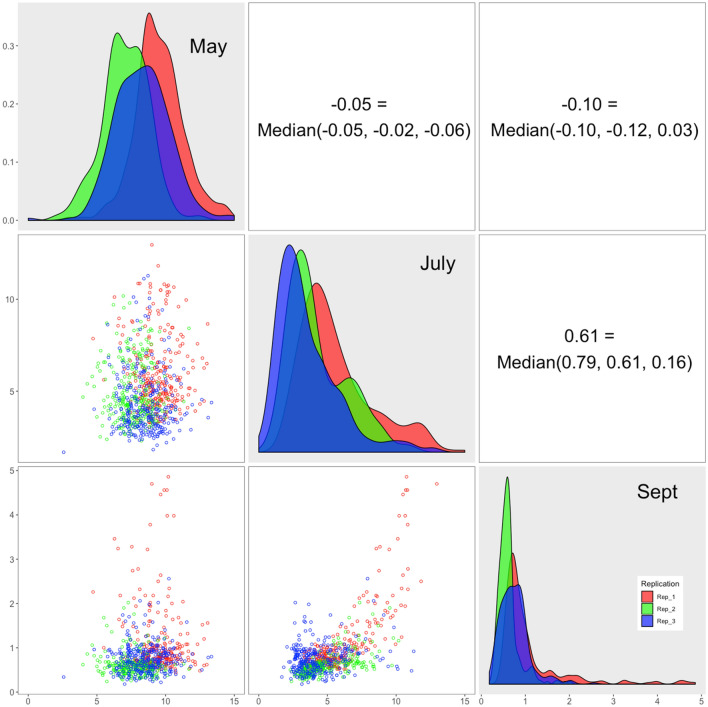
Figure 1.
Distributions, scatter plots, and correlations among biomass harvested in May, July, and September of 2019. The distribution of biomass values is displayed on the diagonal for alfalfa plots harvested on May 6–7, July 8–9, and September 3–4, 2019, with replications indicated by colors. Replication 1 and 2 contained 269 plots; replication 3 contained 270 plots. The correlations among harvest months are displayed as scatter plots in the lower triangular area and as the Pearson correlation coefficients in the upper triangular area.

