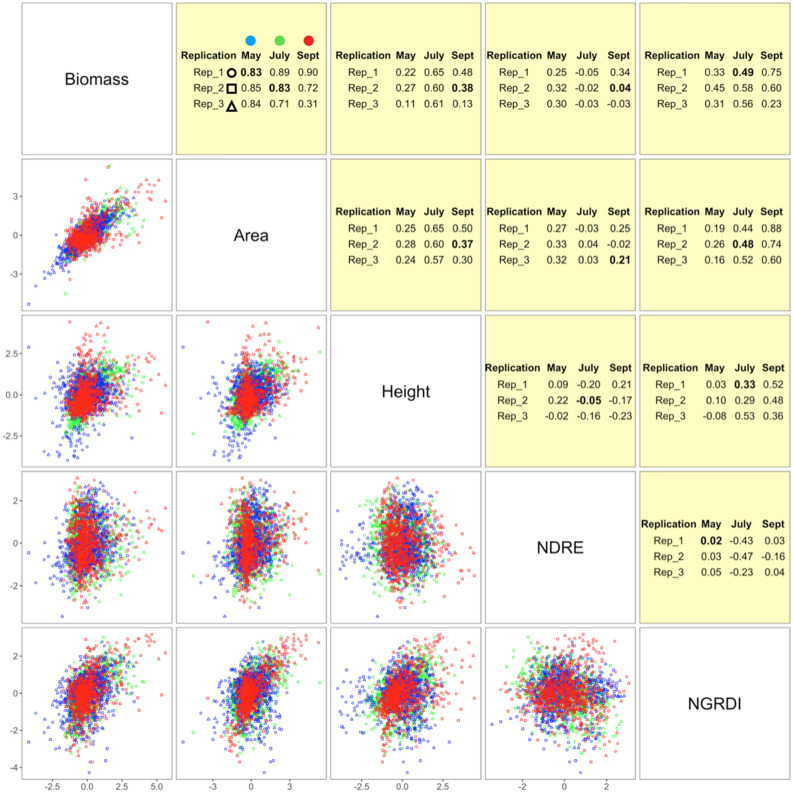
Figure 2.
Correlations among biomass and four image features. The correlations of image features with observed biomass are demonstrated as Pearson correlation coefficients in the upper triangular area and scatter plots in the lower triangular area. The four image features are standardized within combinations of month and replicate. The medians of correlation coefficients are highlighted in bold text. Months are illustrated by colors and replicates by shapes. The four image features are canopy area, plant height, Normalized Difference Red Edge (NDRE) Index, and Normalized Green–Red Difference Index (NGRDI).

