Figure 4.
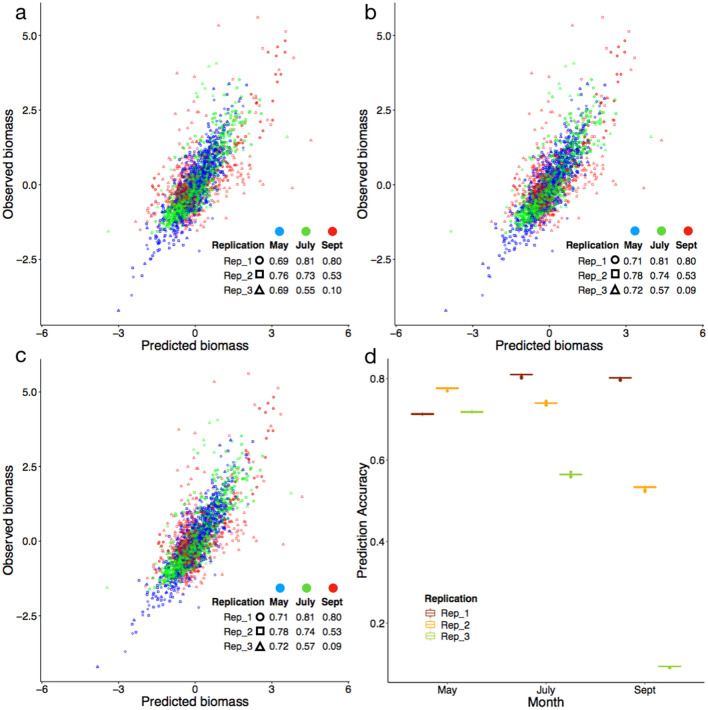
Prediction accuracy under temporal, spatial, and mixed cohort validation. Prediction accuracy was calculated as the coefficient of determination (R2). (a) The temporal cohort was based on months (May, July, and September). Two months were selected as the training data and the remaining month was used for validation. The selection process was repeated until all months were tested. (b) Similarly, two replicates were selected as training under the spatial cohort with the remaining replicate for validation. The selection process was repeated until all replicates were tested. (c) Under a mixed cohort, all plots of three replicates and three months were randomly assigned evenly into three folds. Two folds were used for training and the remaining fold for validation. The process was repeated until all folds were tested. The random assignment was iterated 100 times. One of the iterations was arbitrarily selected for illustration. (d) The distribution of the prediction accuracy is demonstrated by the box plot.

