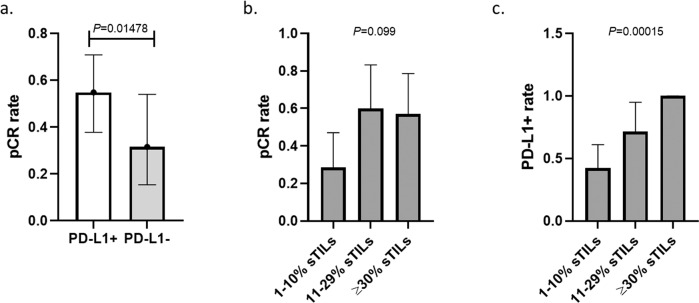
Fig. 2. Distribution of pCR rate by PD-L1 status and manual stromal TILs (sTILs).
a pCR rates in the PD-L1-positive (55%; 95% CI: 0.38–0.71) and -negative (32%; 95% CI: 0.15–0.54) groups, p = 0.148 (two-sided Fisher’s exact test). b pCR rates in cancers with ≥30% sTIL (pCR 57%), 29–10% sTIL (pCR 60%), and <10% sTIL (pCR 29%) groups, p = 0.099 (two-sided Fisher’s exact test). c PD-L1 positivity rates in cancers with sTIL >30%, sTIL 29%–10%, and sTIL <10%, were 100%, 71% and 42%, respectively, p = 0.00015 (two-sided Fisher’s exact test). On all panels error bars represent standard deviations (s.d.).

