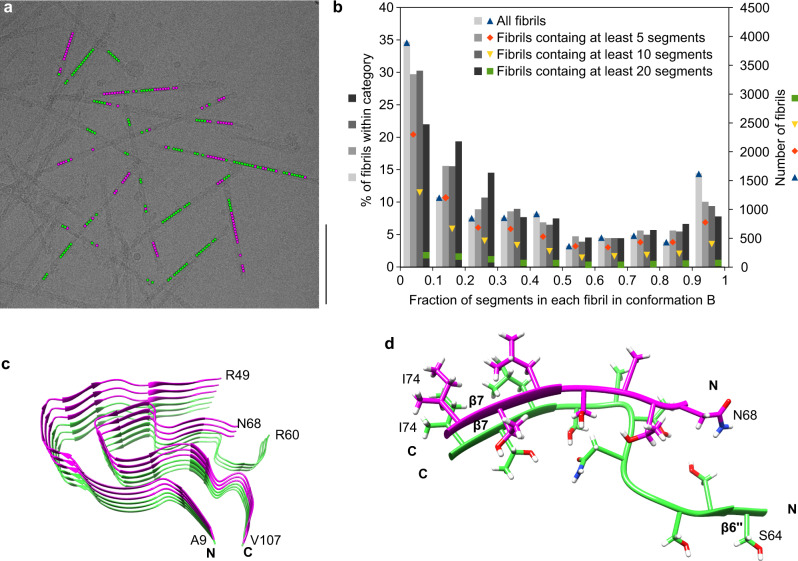
Fig. 4. Evidence for structural breaks in FOR005 fibrils.
a Representative cryo-EM micrograph showing the location of segments classified after the first 3D classification as fibril structure A (green) and fibril structure B (magenta). Scale bar: 100 nm. Data were collected from 1,378 micrographs from one fibril sample. Supplementary Fig. 9a shows the same image, highlighting only the segments used in the final fibril reconstruction. b Histogram of the fraction of segments classified as fibril structure B, per fibril, after the first 3D classification. Different thresholds were chosen for the minimum number of segments per fibril, resulting in four categories: all fibrils (11,194 fibrils), fibrils containing a minimum of 5 segments (7,738 fibrils), fibrils containing a minimum of 10 segments (4,278 fibrils), and fibrils containing a minimum of 20 segments (951 fibrils). The percentages were normed using the total number of fibrils in each category. Colored points show the absolute number of fibrils in each category and group (fraction in conformation B). In total, the data set (n = 101,319) contained 64,652 segments classified as fibril structure A and 36,667 as fibril structure B. Supplementary Fig. 9b shows an analogous histogram, but including only the segments used for the final reconstructions. c Stack of three fibril proteins in conformation B (magenta) on top of three fibril proteins in conformation A (green), illustrating the presence of structural breaks within the patient amyloid fibrils. d Detailed view of a structural break, including side chains.

