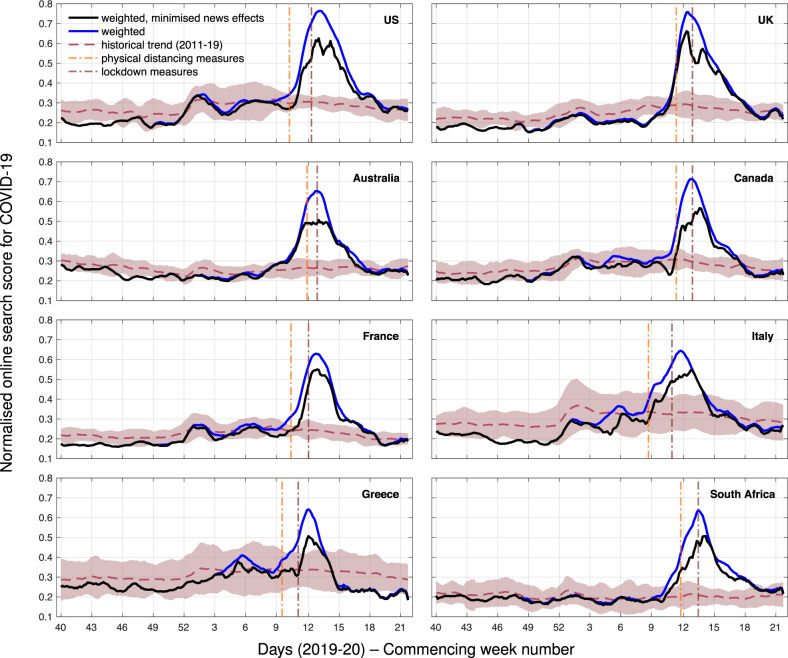
Fig. 1. Online search scores for COVID-19-related symptoms as identified by the FF100 survey, in addition to queries with coronavirus-related terms, for 8 countries from September 30, 2019 to May 24, 2020 (all inclusive).
Query frequencies are weighted by symptom occurrence probability (blue line) and have news media effects minimised (black line). These scores are compared to an average 8-year trend of the weighted model (dashed line) and its corresponding 95% confidence intervals (shaded area). Application dates for physical distancing or lockdown measures are indicated with dash-dotted vertical lines; for countries that deployed different regional approaches, the first application of such measures is depicted. All time series are smoothed using a 7-point moving average, centred around each day.

