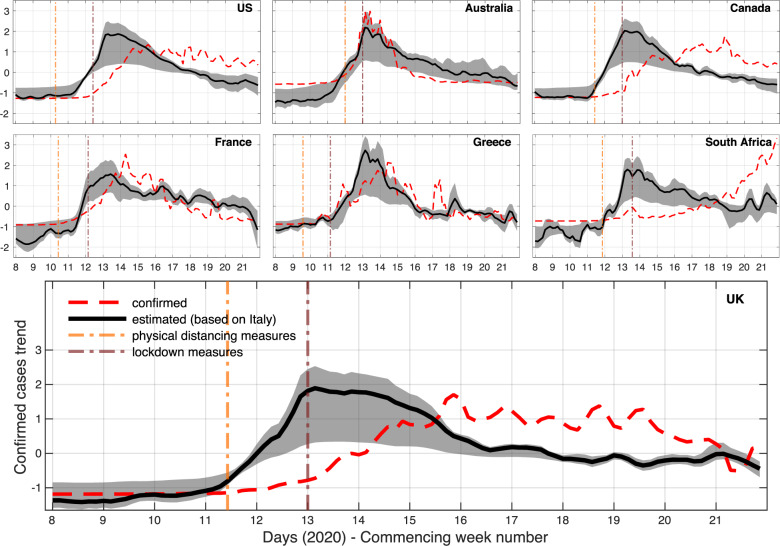
Fig. 3. Transfer learning models based on online search data for 7 countries using Italy as the source country.
The figures show an estimated trend for confirmed COVID-19 cases compared to the reported one. The trend is derived by standardising the transferred estimates (raw values are reflective of the demographics and clinical reporting approach of the source country). The solid line represents the mean estimate from an ensemble of models. The shaded area shows 95% confidence intervals based on all model estimates. Application dates for physical distancing or lockdown measures are indicated with dash-dotted vertical lines; for countries that deployed different regional approaches, the first application of such measures is depicted. Time series are smoothed using a 3-point moving average, centred around each day. We use this minimum amount of smoothing to remove some of the noise for visualisation purposes and maintain our ability to compare the transferred models to the corresponding clinical data.

