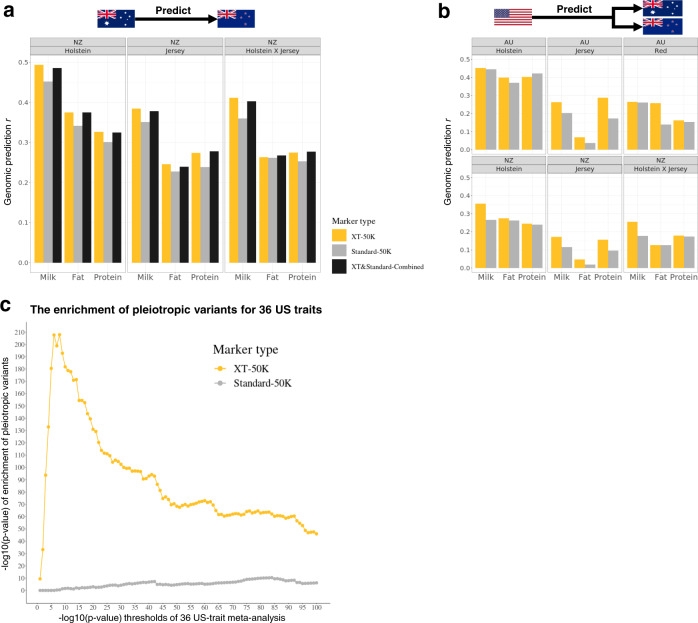
Fig. 5. Comparing customized XT-50K markers with the Standard-50K markers in multiple validation cow sets.
a BayesR genomic prediction trained in an independent set of 28.2k multi-breed Australian cows for three traits and predicted into 21.2k New Zealand cows (pure- and crossbreds). XT&Standard-Combined: combined markers from the XT-50K and Standard-50K panels. b Genomic prediction using a subset of markers from the two 50 K panels that are also found in the US 36-trait GWAS using 27.1k Holstein US bulls for the same three traits and predicted into 28.2k Australian cows and 21.2k New Zealand cows. The US GWAS excluded intergenic and intronic variants29 and their sequence variant imputation was based on Run 5 of the 1000 Bull Genomes project4. c The enrichment of pleiotropic variants from the US 36-trait GWAS in the two 50K panels. Note that only 19 of 36 US traits were present in the 34 Australian traits used to prioritise the XT-50K markers (Supplementary Table 3). X-axis: multi-trait p-value thresholds (0–100 on −log10 scale) used to select significant pleiotropic variants for USA traits. Y-axis: the significance of enrichment (hypergeometric test) of pleiotropic variants for USA traits based on the number significant variants at each multi-trait p-value threshold (X-axis) within the XT-50K markers and within the Standard-50K markers.

