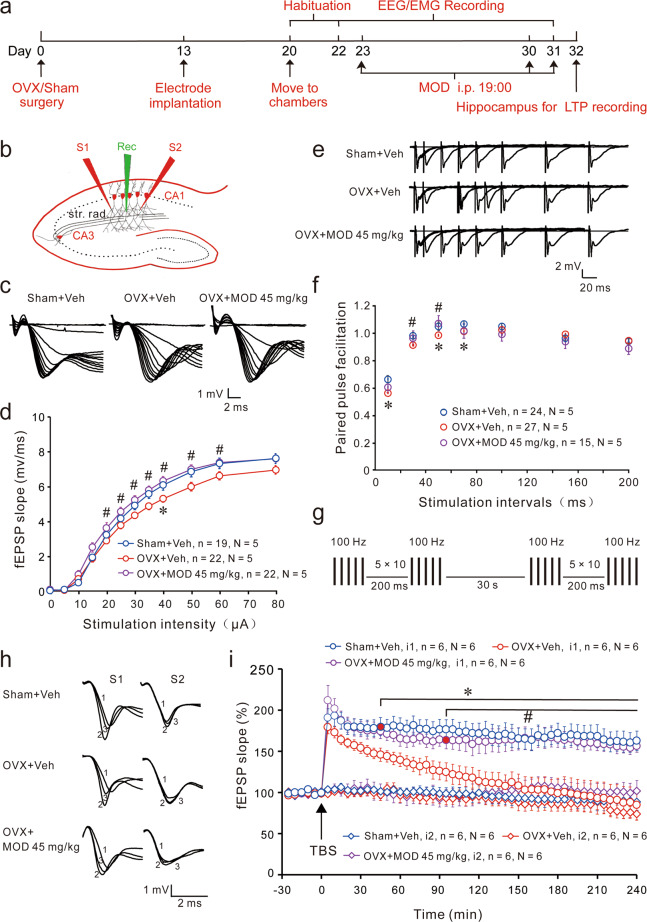
Fig. 3. Modafinil rescues ovariectomy-induced impairments of hippocampal basal transmission and long-term potentiation in hippocampal slices ex vivo.
a At the end of sleep recordings, the hippocampus of each animal was separated for electrophysiological experiments. b Diagram of a hippocampal slice showing the placement of electrodes. The stimulation electrodes (red, S1, S2) were placed in the stratum radiatum (str. rad.) area of the hippocampal CA1 region. A recording electrode (green, Rec) was placed in between to record field excitatory postsynaptic potentials (fEPSPs) evoked by extracellular stimulation of Schaffer collaterals by the S1 input. The S2 input was used as a control input to monitor baseline stability. c Representative traces of fEPSPs obtained after a set of consecutive stimuli. d The input-output relationship of basal synaptic transmission was obtained by plotting the slope of fEPSPs against stimulation intensity in different groups of mice. e Sample fEPSP traces of paired-pulse facilitation (PPF, ratios of the second fEPSP and the first fEPSP obtained at different interstimulus intervals). f PPF was obtained in different groups of mice. *p < 0.05 versus Sham+Vehicle (Veh) group; #p < 0.05 versus OVX+Veh group assessed by Mann–Whitney U tests in (d) and (f). g Schematic representation of the stimulation protocols used for the induction of long-term potentiation (LTP). Two trains of theta-burst stimulation (TBS) with a 30-s inter-train interval were delivered to induce LTP. h Sample traces of fEPSPs at 0, 5, and 180 min (marked as 1, 2, and 3, respectively). i Time courses of normalized initial slope measurements of fEPSPs. Every data point represented the averaged data of four consecutive sweeps with an interval of 10 s. LTP was evoked by TBS indicated by black arrowheads. *p < 0.05 versus Sham+Veh group; #p < 0.05 versus OVX+Veh group. The black horizontal bars cover all the significantly different time points. N indicates the numbers of animals, while n indicates the numbers of slices. The non-tetanized baseline recording by input S2 remained stable in the different groups.

