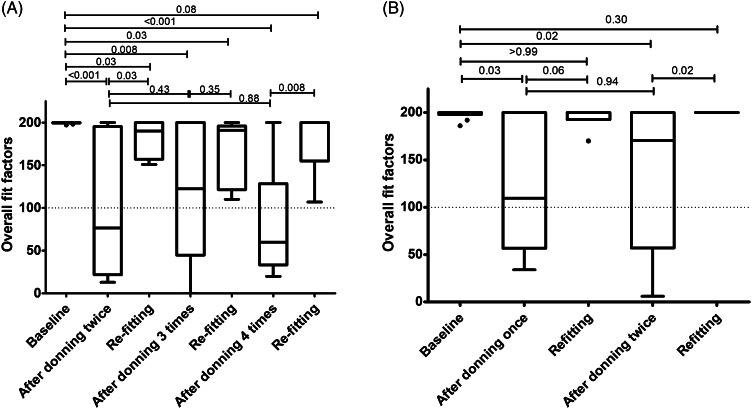
Fig. 2.
Overall fit factors of the participants at baseline and after repetitive donning/doffing. (A) Results of 1-hour-donning. (B) Results of 3 hours donning. Boxes represent the median and interquartile range [IQR]. Whiskers indicate the upper and lower adjacent values (within 1.5 × IQR), and isolated dots are outlier data points.

