Figure 1.
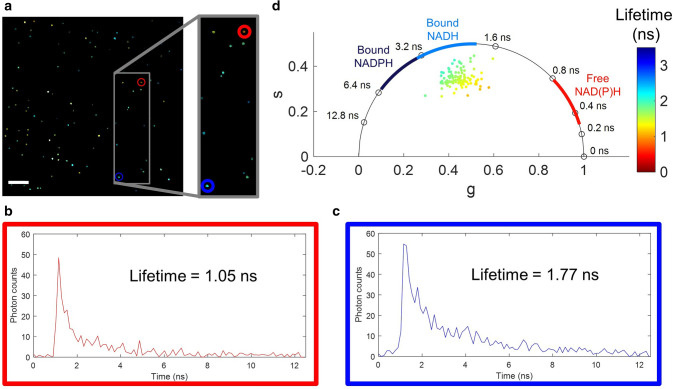
Heterogeneity of fluorescence lifetimes in extracellular vesicles (EVs). (a) Fluorescence lifetime-weighted intensity image of EVs derived from MDA-MB-231 cells. The brightness of a pixel corresponds to intensity and the color corresponds to fluorescence lifetime in nanoseconds, using the same fluorescence lifetime scale as in panel (d). (b) Example fluorescence decay curve of a shorter fluorescence lifetime corresponding to the EV in the red circle in panel (a). (c) Example fluorescence decay curve of a longer fluorescence lifetime corresponding to the EV in the blue circle in panel (a). (d) Phasor plot of the frequency components of the exponential decays. Each point on the plot represents a single EV from the image in (a). The color of the point represents the fluorescence lifetime of the EV in nanoseconds. Approximate fluorescence lifetime values of protein-bound and free NAD(P)H are labeled based on previous studies25,33. Scale bar represents 20 μm.

