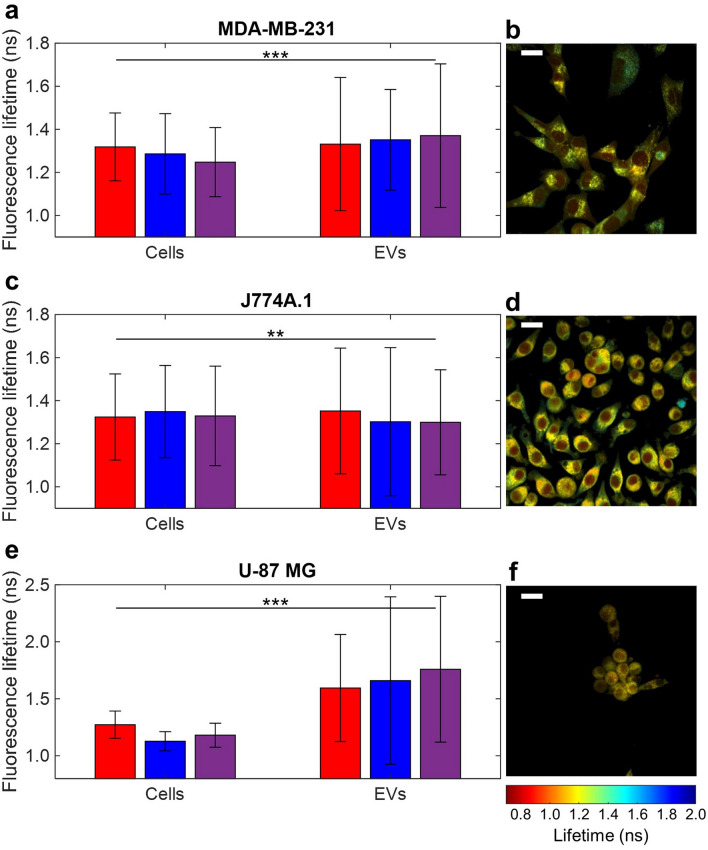
Figure 4.
Fluorescence lifetime values of extracellular vesicles (EVs) and their parent cells for three cell lines: (a,b) MDA-MB-231 human epithelial breast cancer, (c,d) J774A.1 mouse macrophage, and (e,f) U-87 MG human glioblastoma. Mean and standard deviation of fluorescence lifetime values are indicated in the bar charts for three different replicates of each cell line, with each replicate indicated by color (replicate 1: red, replicate 2: blue, replicate 3: purple), in (a,c,e). Each replicate consisted of 4 fields-of-view (FOVs) for cells and 16 FOVs for EVs. One example FOV of each cell line is given as well: (b) MDA-MB-231, (d) J774A.1, and (f) U-87 MG. **Indicates P < 0.01, *** indicates P < 0.001. First replicate is indicated in red, second in blue, and third in purple. Scale bars represent 20 μm. The total number of vesicles (n) for each experimental group pooled together is as follows: MDA-MB-231 n = 561, J774A.1 n = 968, U-87 MG n = 178.

