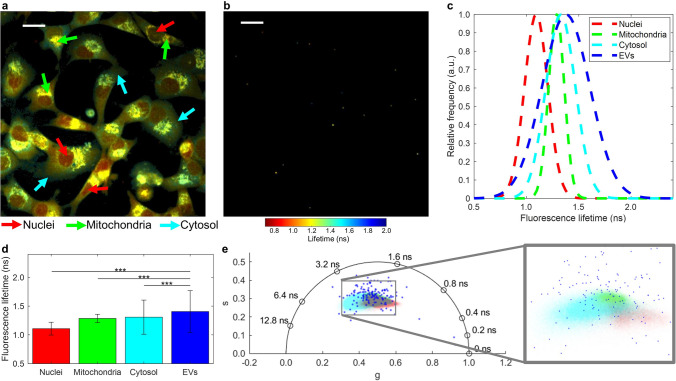
Figure 5.
FLIM signature of extracellular vesicles (EVs) and the cellular components of their parent cells. (a) Fluorescence lifetime-weighted image of MDA-MB-231 cells with corresponding arrows for nuclei (red), mitochondria (green), and cytosol (cyan). (b) Fluorescence lifetime-weighted image of EVs. Color bar for FLIM images given in ns. (c) Fluorescence lifetime Gaussian fits of major cellular components and EVs. (d) Bar chart showing mean and standard deviation of fluorescence lifetime distributions. *** indicates P < 0.001. (e) Phasor plot showing the phasor components of EVs (blue) and the cellular nuclei (red), mitochondria (green), and cytosol (cyan). Scale bars represent 20 μm.

