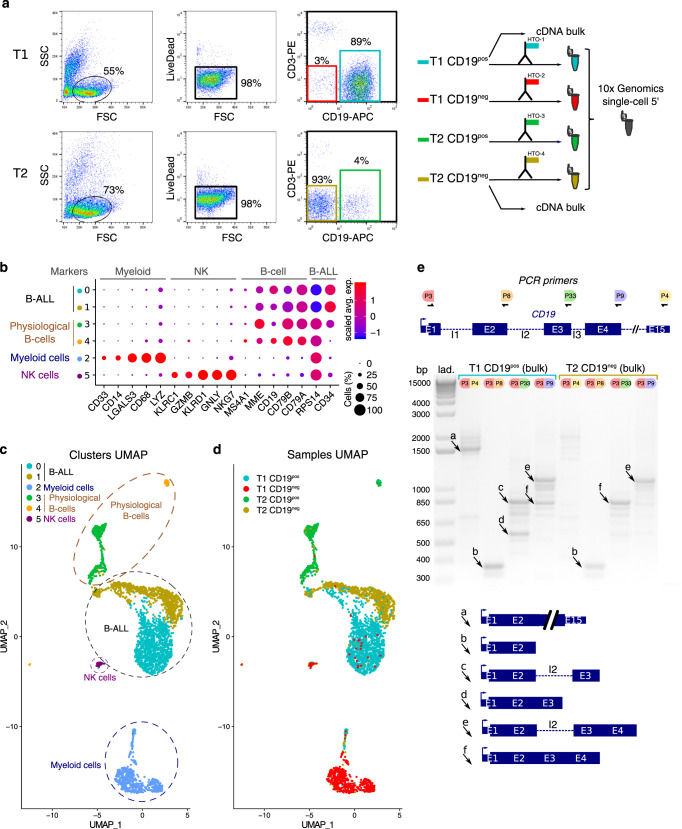
Fig. 1. CD19neg B-ALL relapse following CAR-T therapy.
a Cell sorting strategy. Cells before (T1) and after (T2) CAR-T treatment were gated according to FSC/SSC profile (left FACS plots). Then, live cells (middle FACS plots) were analyzed according to CD3 and CD19 expression (right FACS plots; see also Supplementary Fig. 9). Gates of the four sorted subpopulations T1-CD19pos, T1-CD19neg, T2-CD19pos, and T2-CD19neg are highlighted in cyan, red, green, and gold, respectively. Those sorted subpopulations were labeled with a specific anti-CD45-HTO antibody, then multiplexed and analyzed by scRNAseq using the 10× Genomics single-cell 5′ technology. Some cells from T1-CD19pos and T2-CD19neg samples were used in bulk to prepare cDNA. b Seurat Dotplot showing the expression level of marker genes in each cluster. Dot size represents the percentage of cell expressing the gene of interest, while dot color represents the scaled average expression (Scaled Avg. Exp.) of the gene of interest across the various clusters (a negative value corresponds to an expression below the mean expression). We used CD34 and RPS14 expression as tumoral markers. Indeed FISH analysis revealed a 5q32 deletion, explaining RPS14 lower expression in B-ALL cells. c UMAP visualization of the six main clusters and their corresponding cell types of T1 and T2 sorted samples. d UMAP visualization of the four demultiplexed samples: T1-CD19neg, T1-CD19pos, T2-CD19neg, and T2-CD19pos. e Agarose gel of CD19 cDNA amplified products using exons-specific primer sets depicted on the top panel. PCR were performed with bulk cDNA from T1-CD19pos cells and T2-CD19neg cells. Agarose gel data are representative of two independent experiments. Lane “Lad” is the 1 kb DNA size marker. Schematic representations of PCR products indicated by “a”–“f” arrows are shown below the gel.

